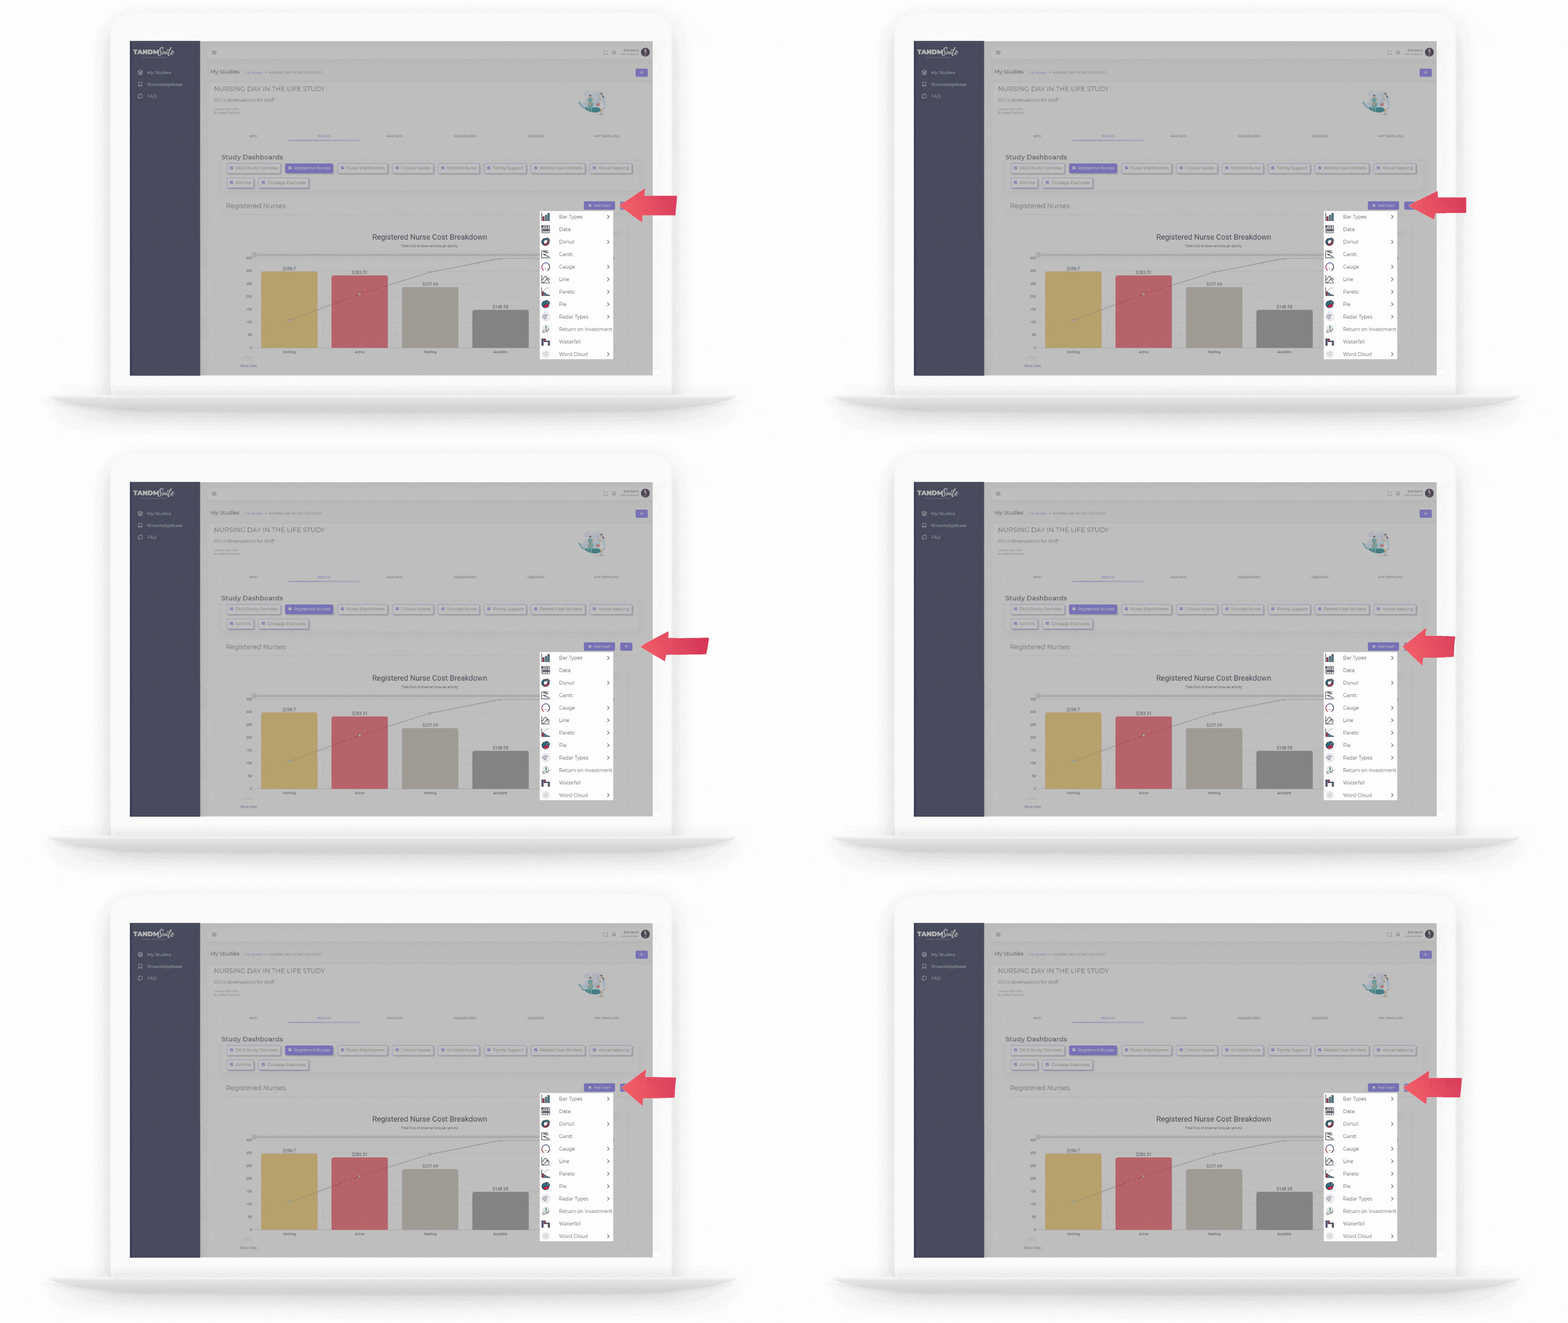
Creating a graph is a matter of a few mouse clicks.
First, make sure you are viewing the Dashboard you wish to add the Graph to.
Click on the purple “Add Graph” button.
Click on the Graph type. Depending on the type, you may need to select from a sub category.
(Eg: Bar Types > Bar Grouped)
Select the type and sub type of measurement:

Cost
- Of Observed
- Of Tasks
Time
- Of Observed
- Of Tasks
Count
- Of Labels
- Of Observed
- Of Survey Answers / tags
- Of Tasks
This will create your Graph, with a green “success!” message and redirect you to the ‘Edit Graph’ view so you can amend your titles, colour sets and apply any different data sets and filters you may need.
Check out the next section for more on Editing Graphs.
