There are two ways to land in the Edit Graph view.
1. After Creating a Graph (see above)
2. Click on the ellipses menu of an existing graph and select “Edit Graph”
This will bring you to a page with four new tabs:
1. Labels
2. Data Set
3. Filters
4. Properties
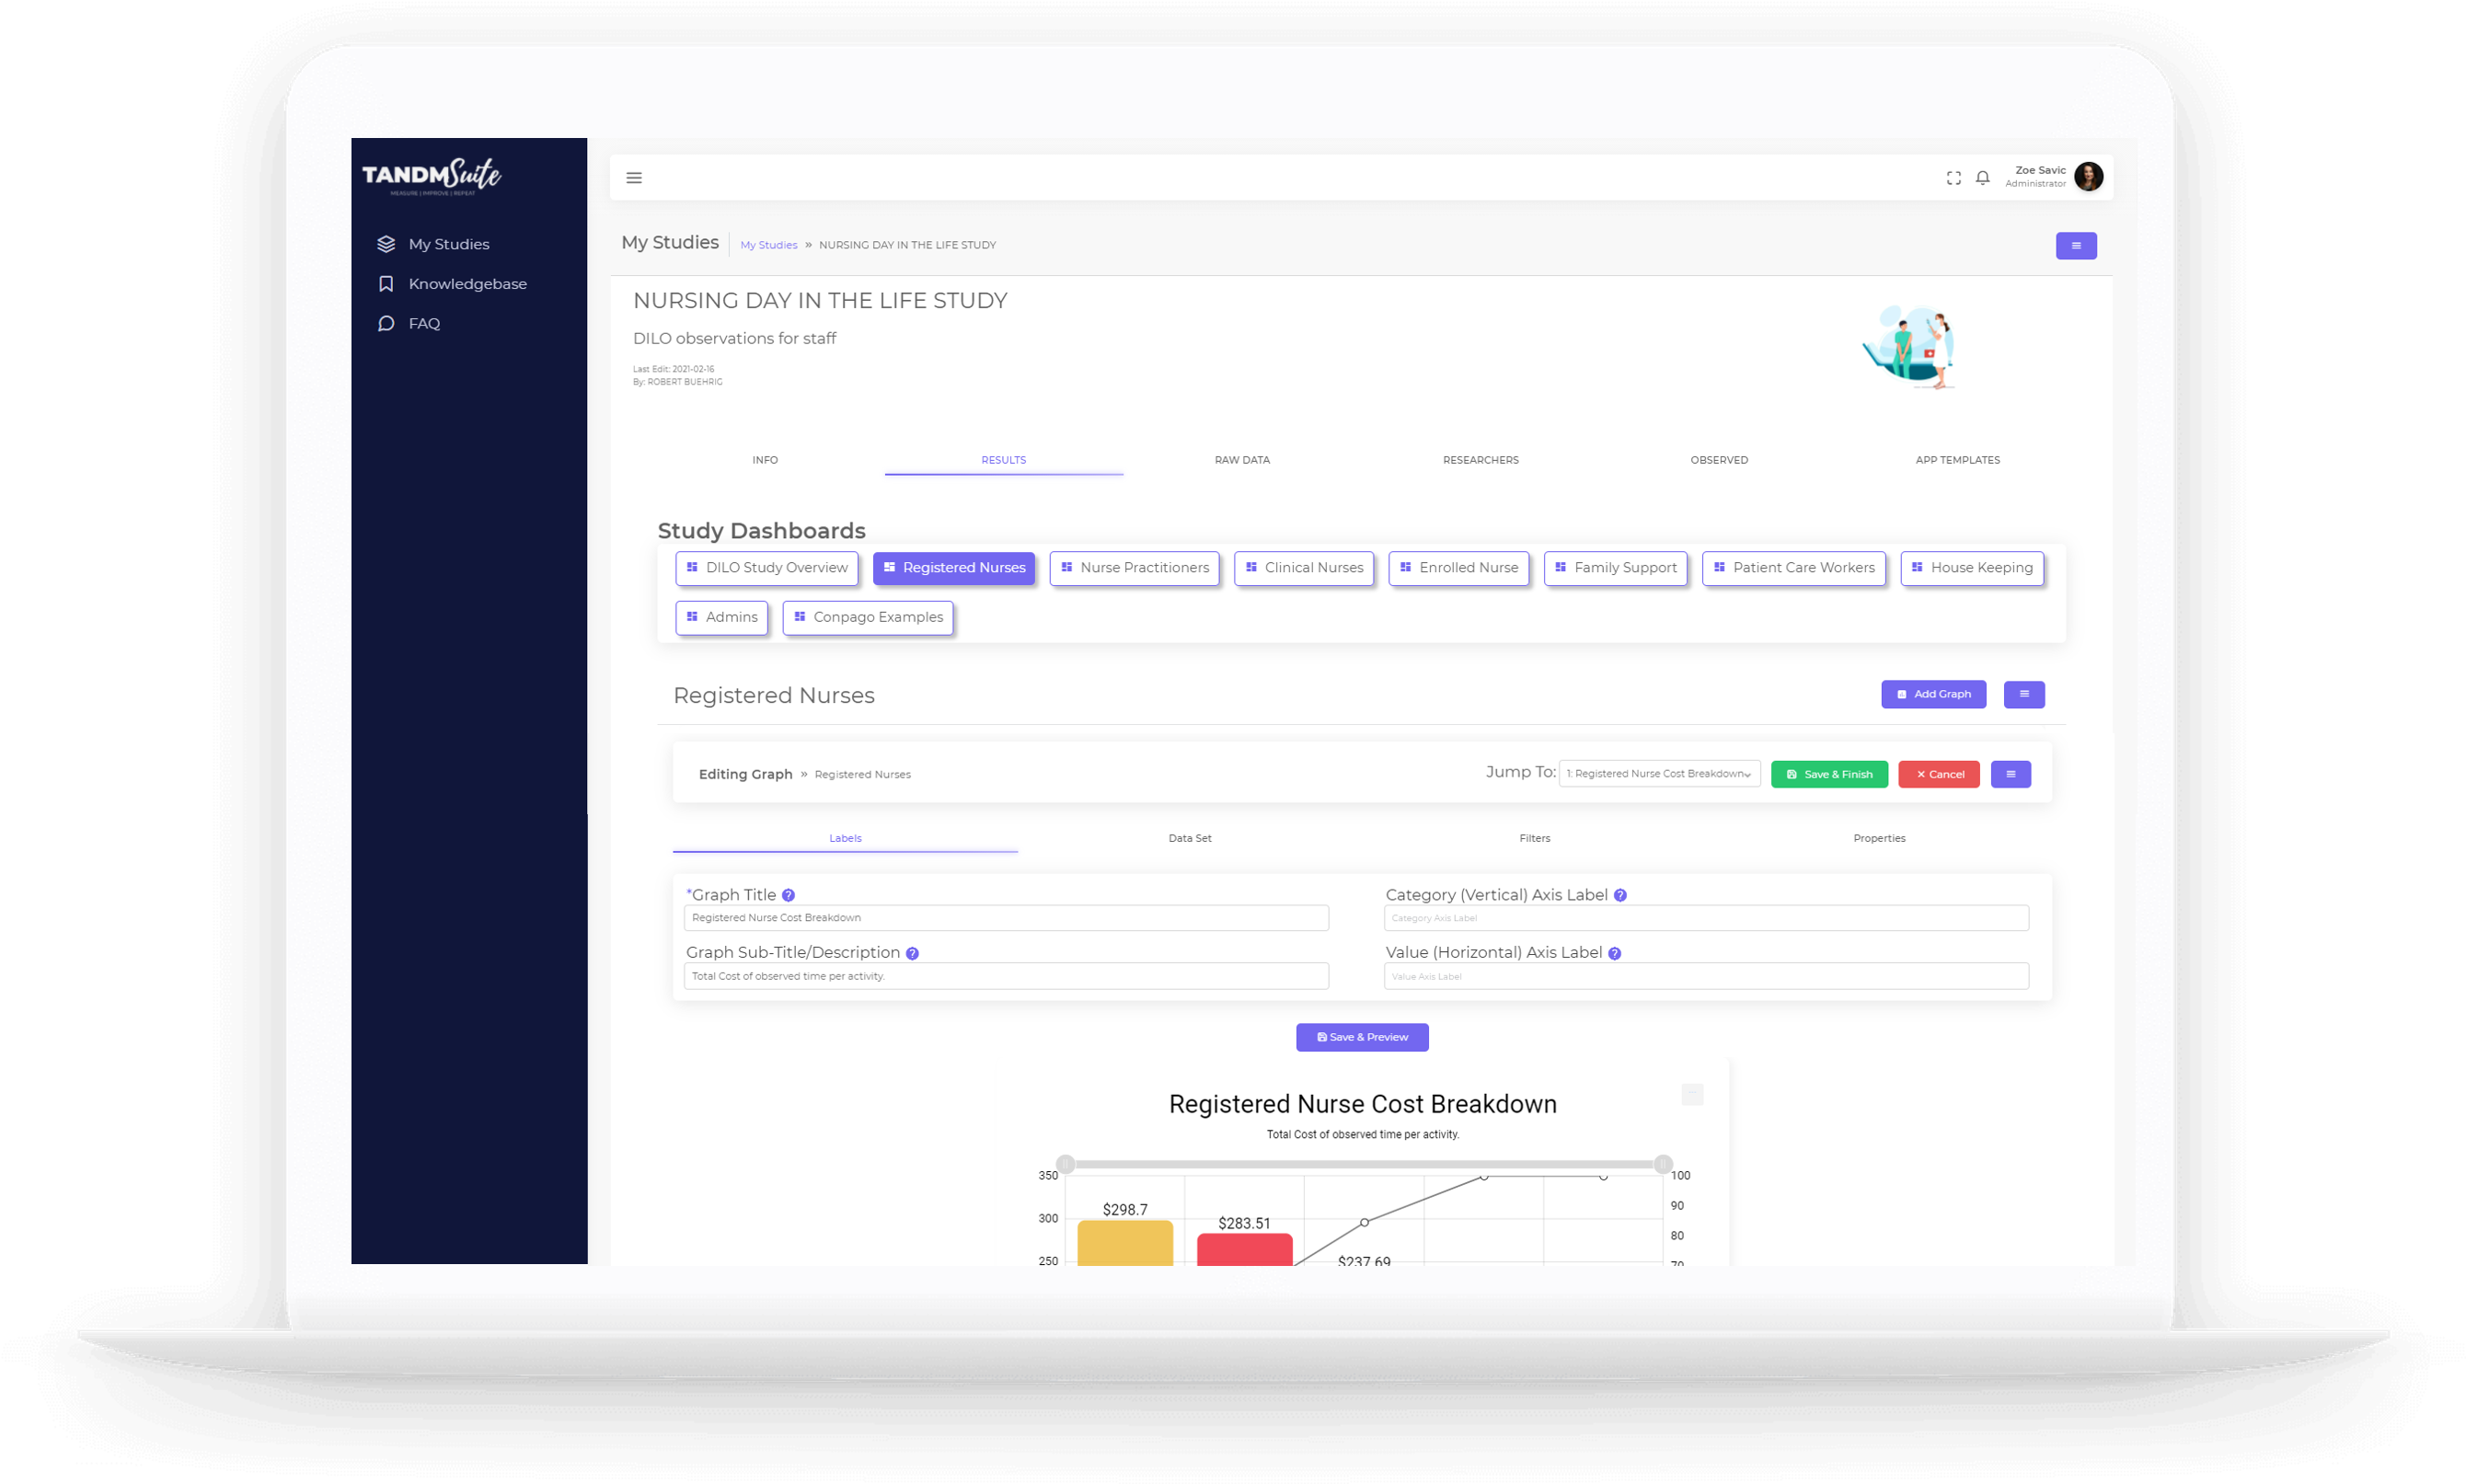
Labels
This is your space to name and label your graph as you see fit. A title and subtitle will automatically generate with the creation of a new graph. A title is a required field and should always reflect wording that makes sense to you and your project.
To change the title, subtitle and/or axis labels, simply click in the corresponding text field and type.
Click the purple Save & Preview button. As the button suggest a preview of your changes will appear below. You can make as many changes and create a preview as you wish.
You can switch to other Edit Graph tabs to continue editing. Once you’re happy with all your changes click the green Save & Finish button.
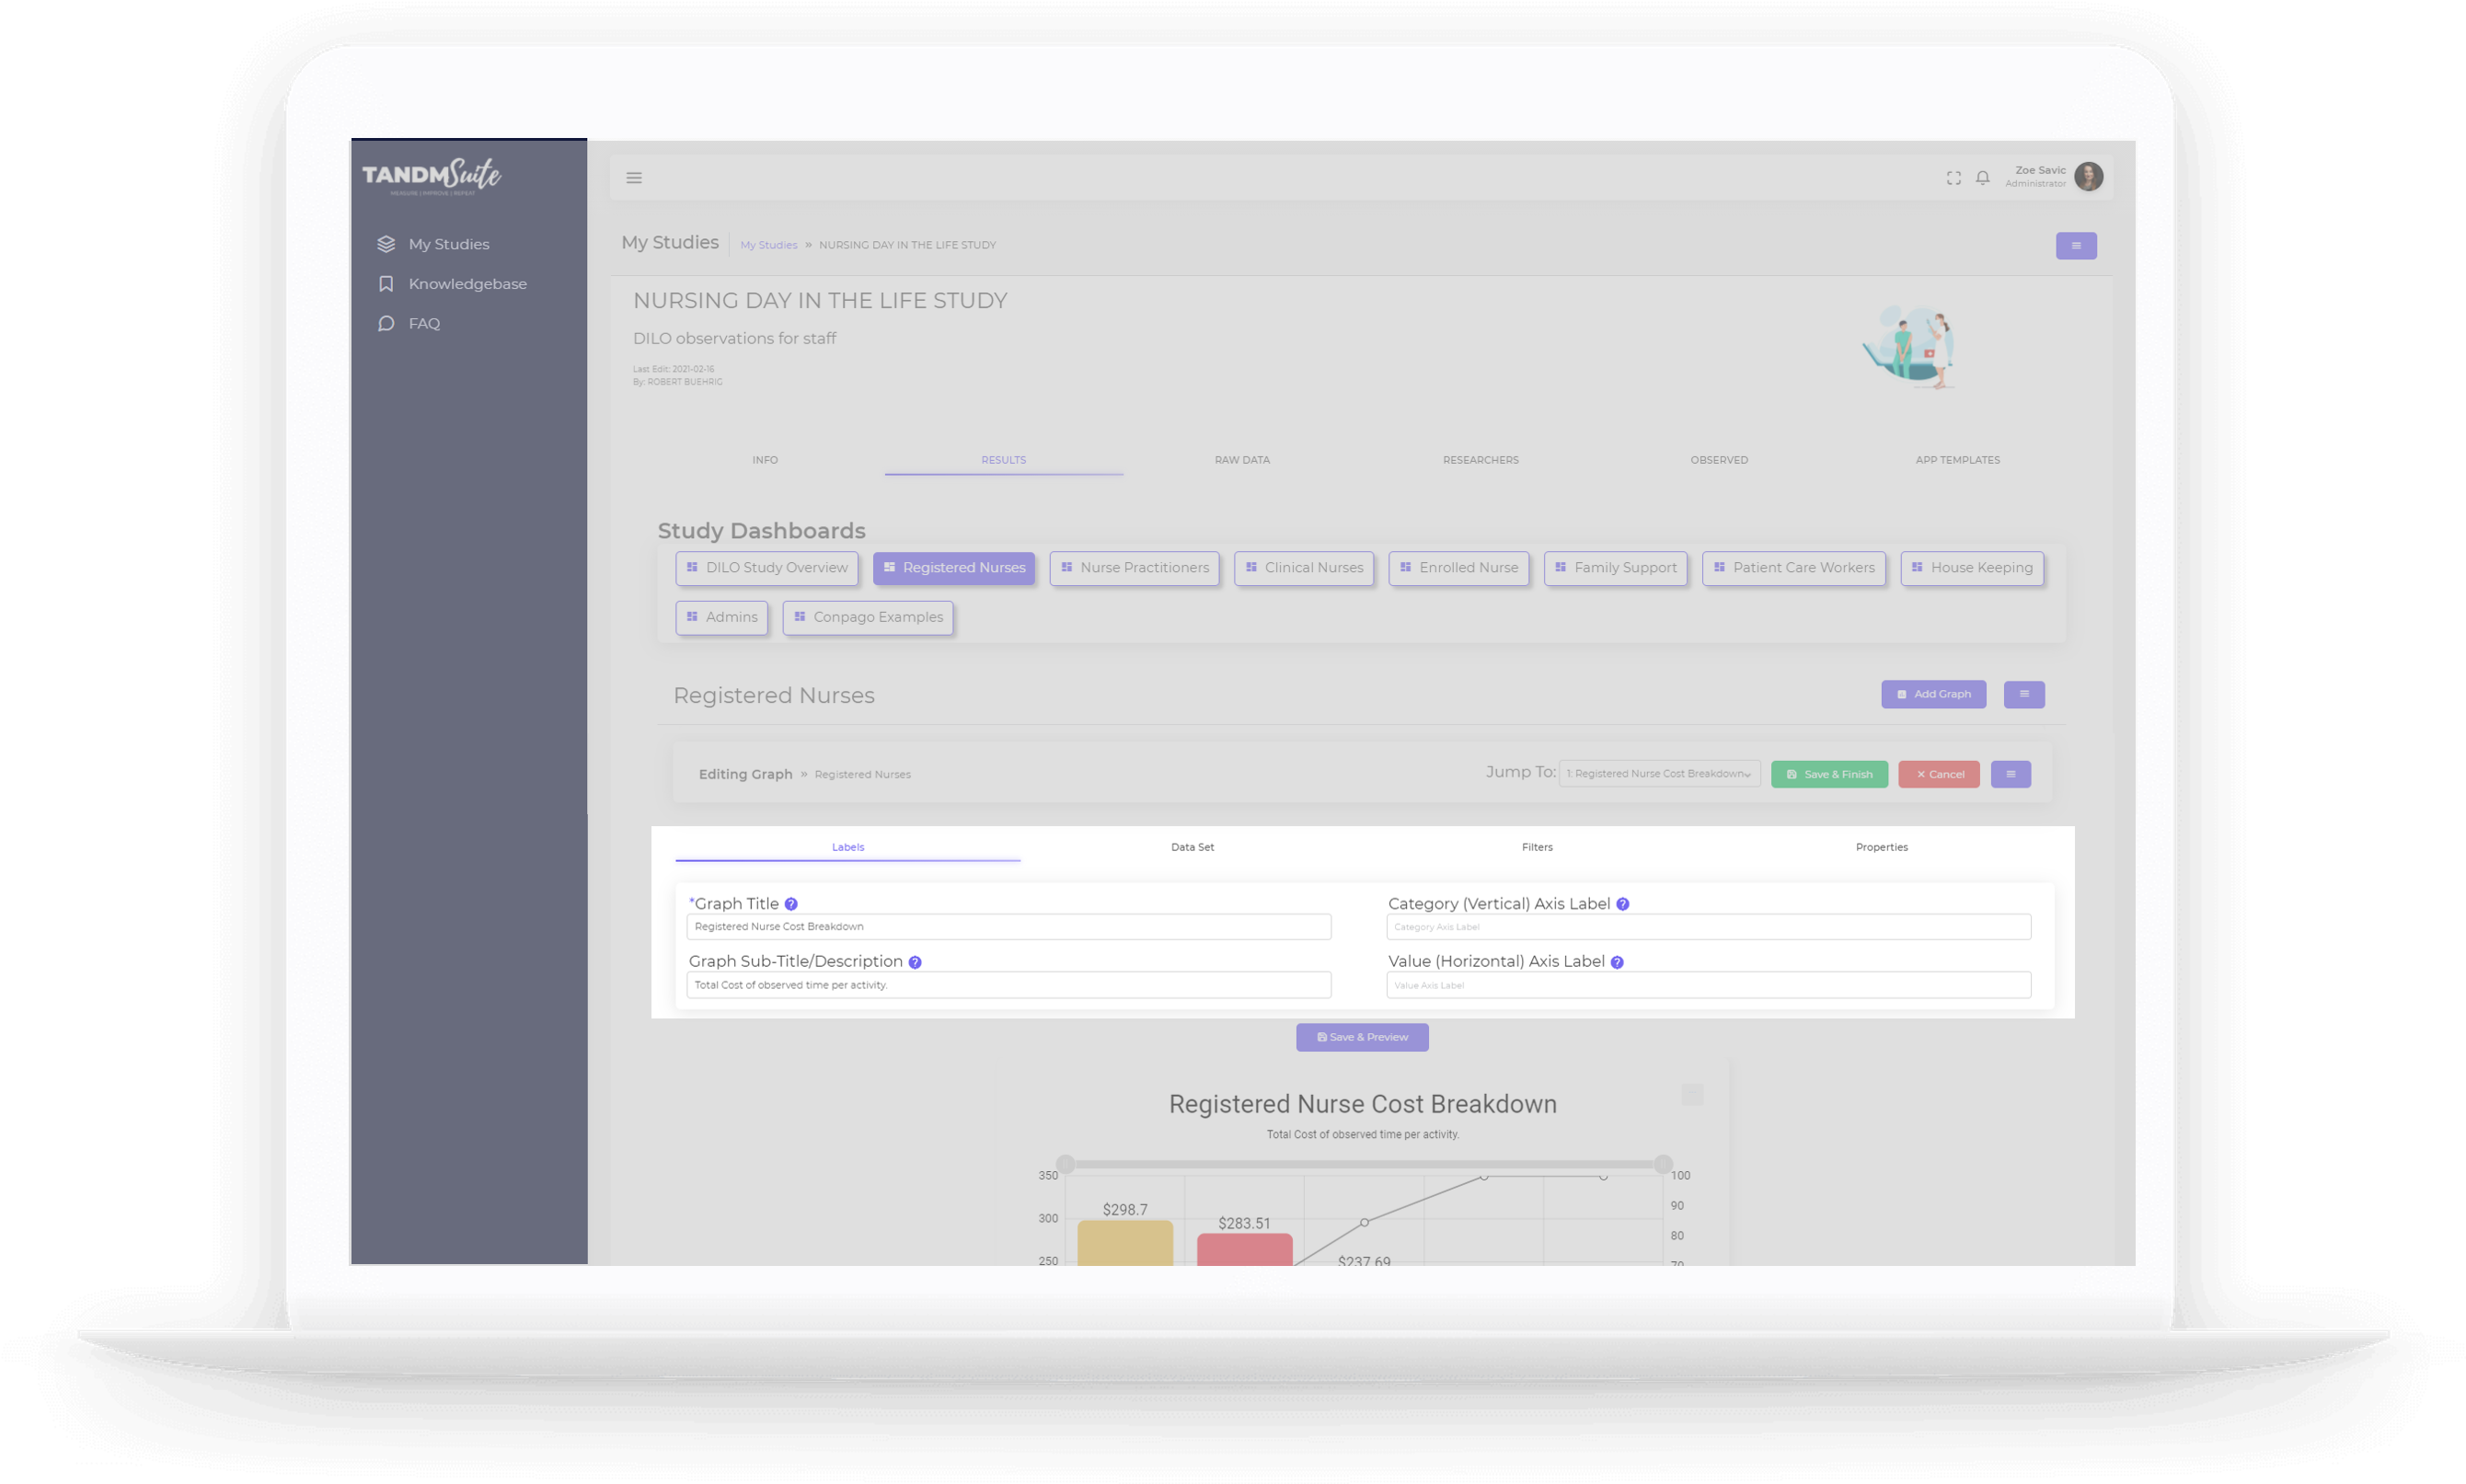
Data Set
This section is core to your graph and is where you choose what sections of the collected data to pull from.
This screen will differ depending on what type of graph you create, but generally will break down into three sections:
1. Graph Axes
The Category and/or Series are used to populate the middle of the graph. This is the “What” of the graph.
Use the dropdown menus to select the data set you wish to include. The required fields will be marked with an asterisk (*)
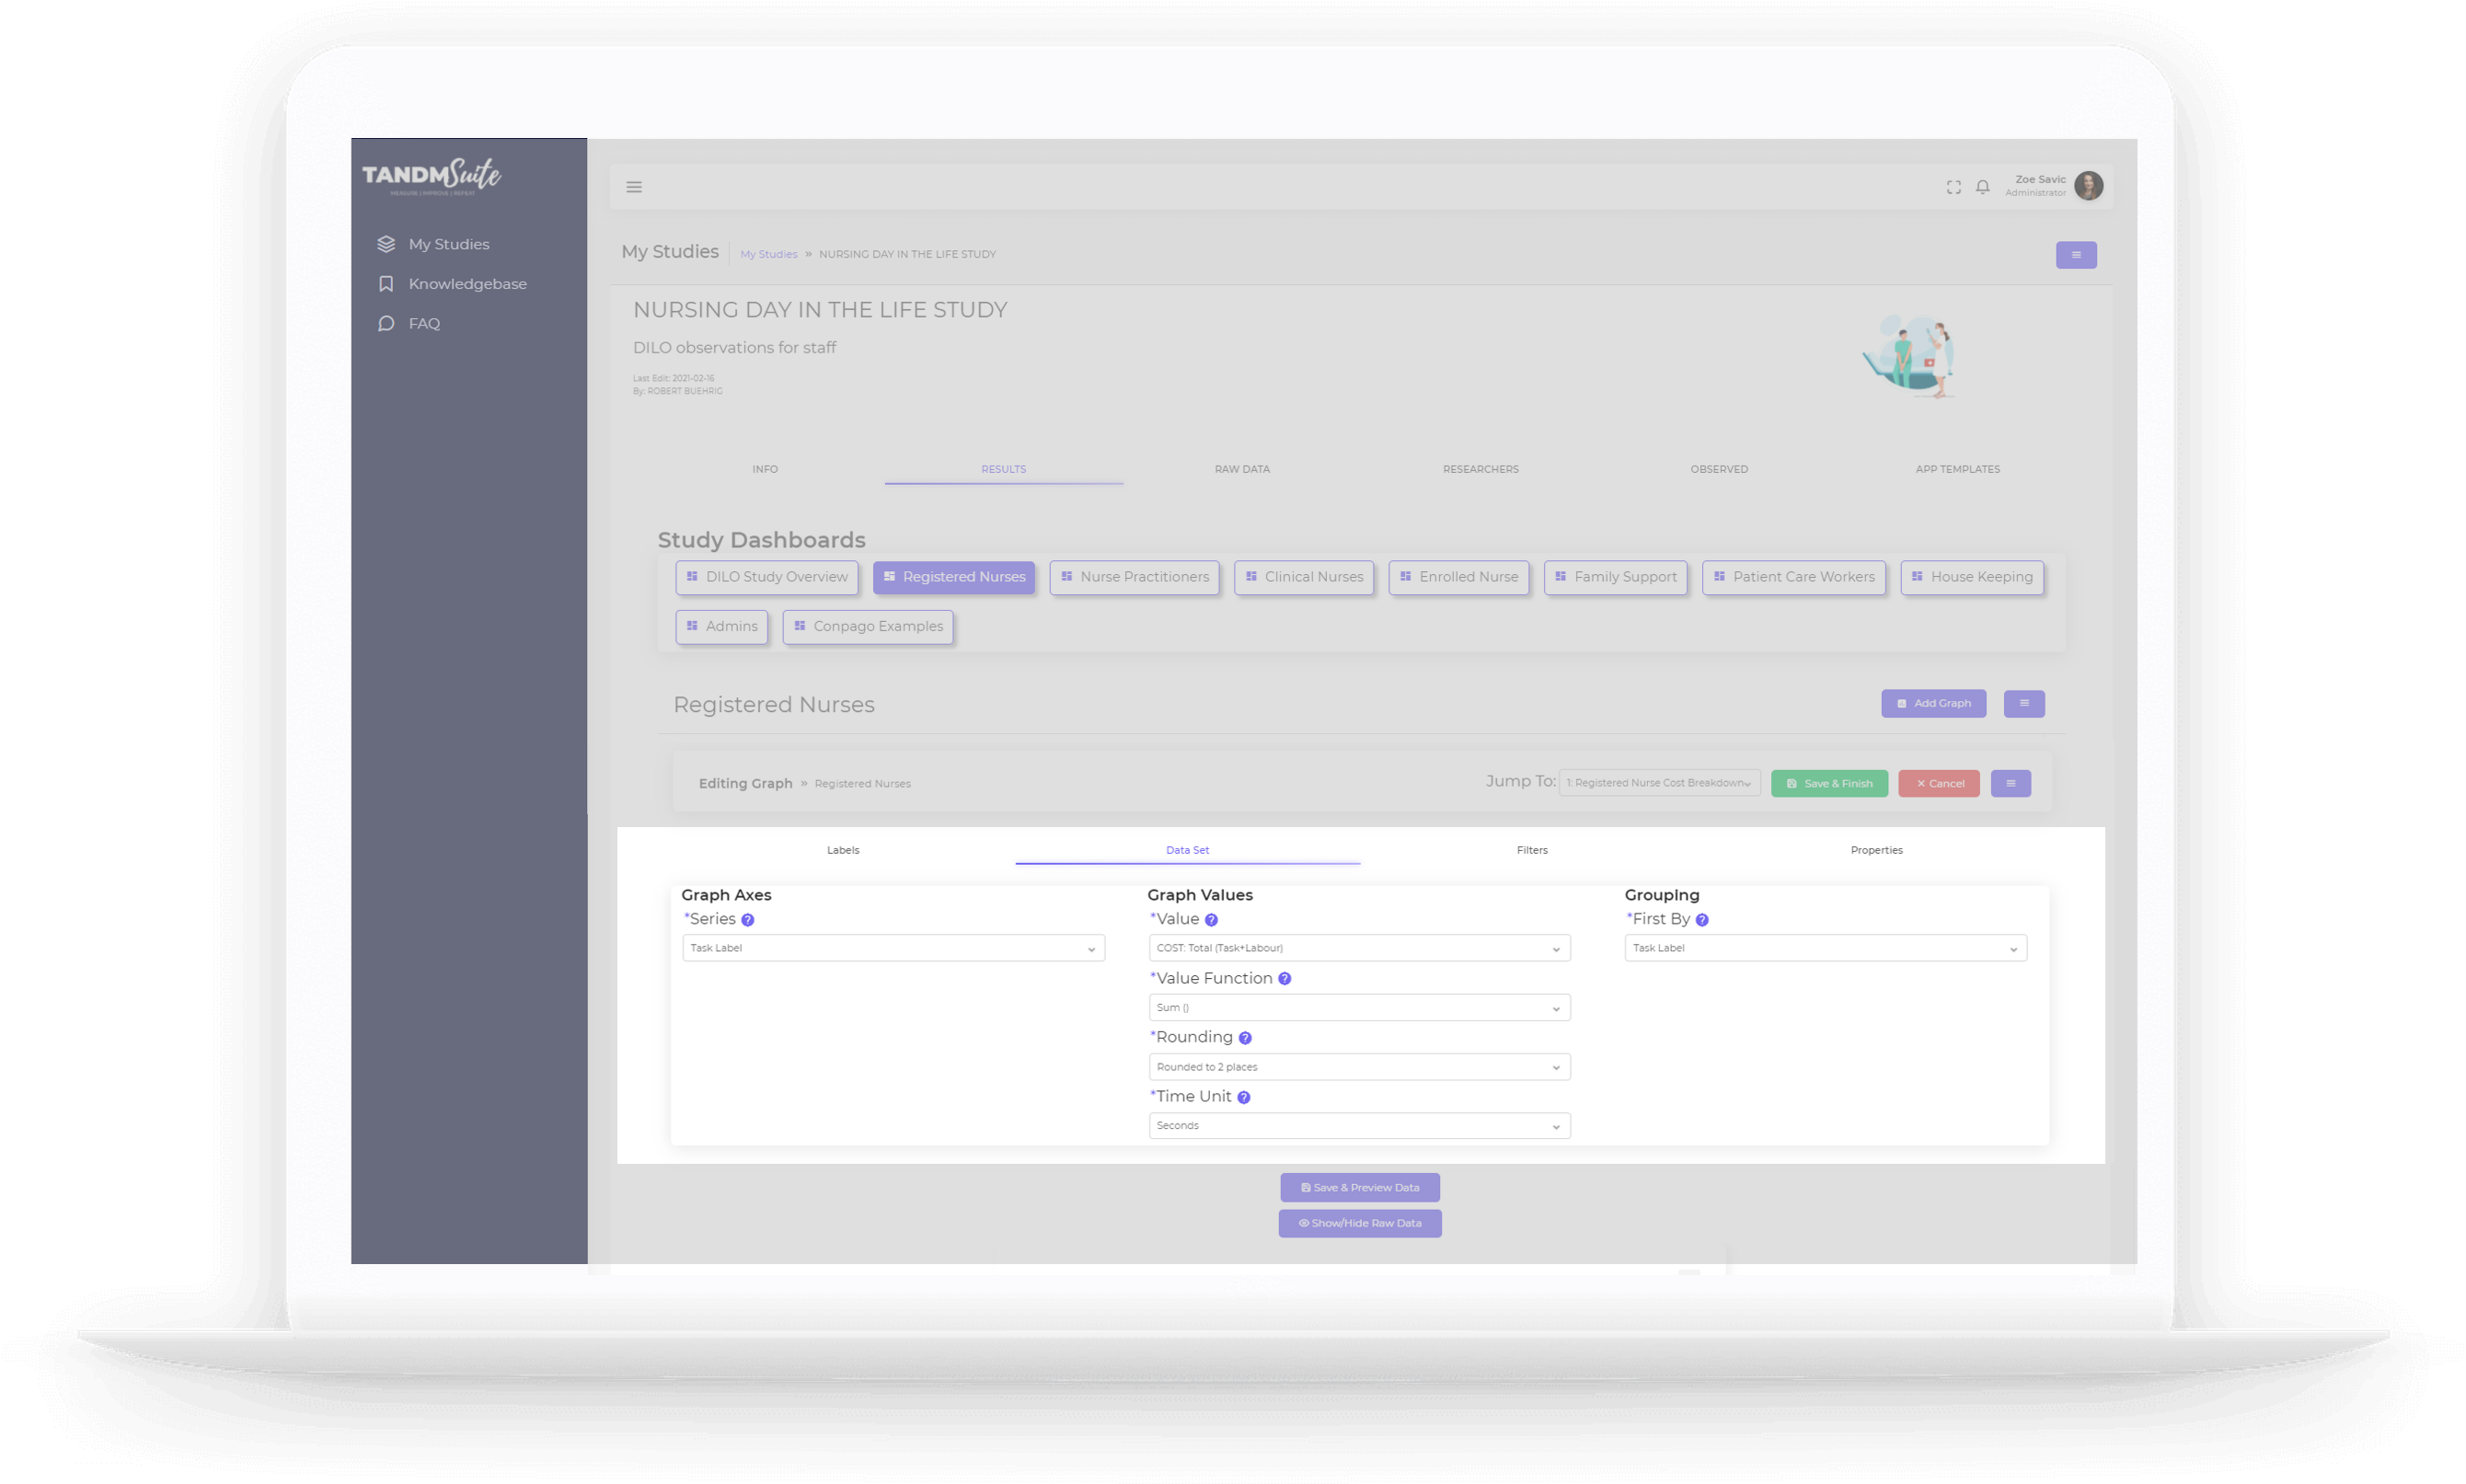
2. Graph Values
This section will determine “How” the data set will be broken down. This may be via time, cost or count (like the options provided when creating the graph) with further options to choose between sum and average, rounding and units (depending on the Value selected)
Use the dropdown menus to select the value options you wish to include. The required fields will be marked with an asterisk (*)
3. Grouping
Grouping, as the title suggests will determine how the data will be grouped together. In some cases you will have the option for a second round of grouping options. By default the “First” group by will match the first Graph Axes option (Category or Series)
Use the dropdown menus to select the value options you wish to include. The required fields will be marked with an asterisk (*)
Click the purple Save & Preview button. As the button suggest a preview of your changes will appear below. You can make as many changes and create a preview as you wish.
You can switch to other Edit Graph tabs to continue editing. Once you’re happy with all your changes click the green Save & Finish button.
Filters
This will help to narrow in on a particular group or set of data. You may want to look at just one particular task, Observed party or a particular day throughout the study.
Simply click on tick box for the filter you wish to activate and use the menu that will appear to select the items you wish to filter by.
To select more than one item simply click your first item and hold the control button on your keyboard to select the rest.
When you have Filter items ticked, the associated menus will always remain visible.
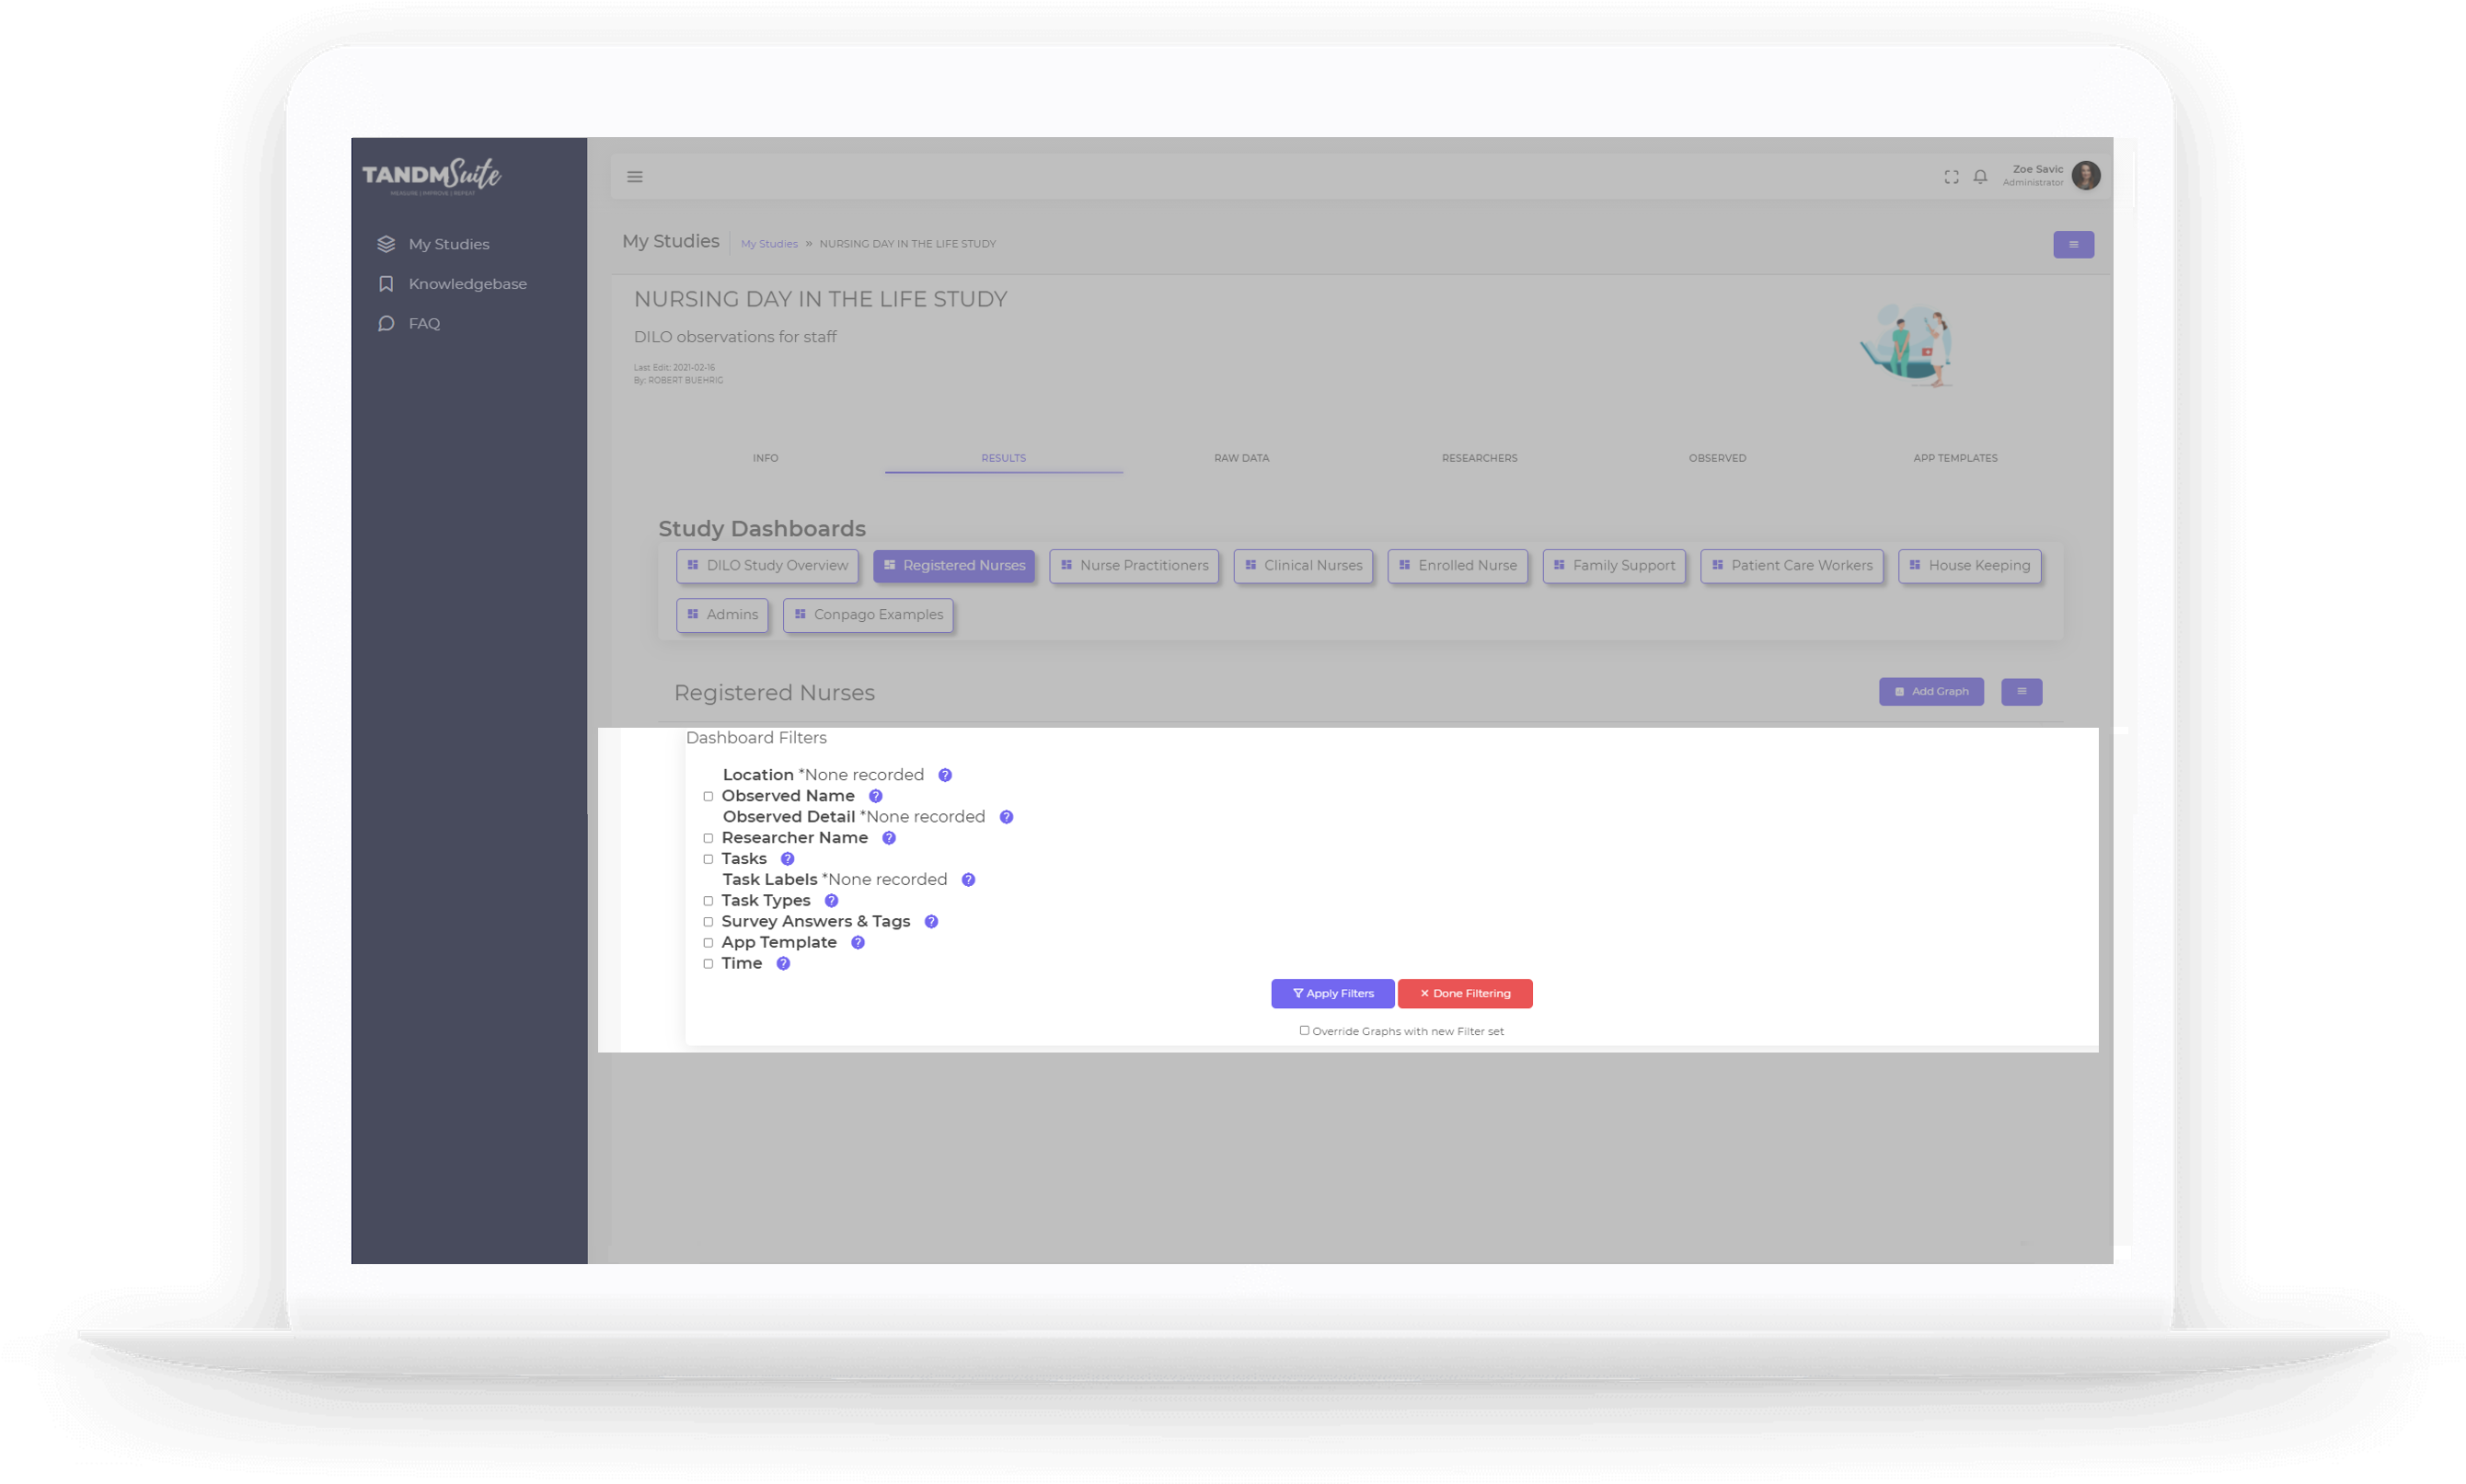
If there is no data collected for a particular Filter item, the same will be indicated with a “None Recorded” note next to it.
Click the purple Save & Preview button. As the button suggest a preview of your changes will appear below. You can make as many changes and create a preview as you wish.
You can switch to other Edit Graph tabs to continue editing. Once you’re happy with all your changes click the green Save & Finish button.
Properties
Here, it’s all about appearances.
You can change the size of the graph to have a really tall graph and/or change with width to have up to four graphs side by side across the width of your Dashboard. Keep in mind graphs with large data sets may not work well with a smaller size.
You can also include the option to show the raw data table associated with the data sets included in creating the graph, ensure any dashboard colouring properties can’t override the graph and choose to include zero fill survey responses.
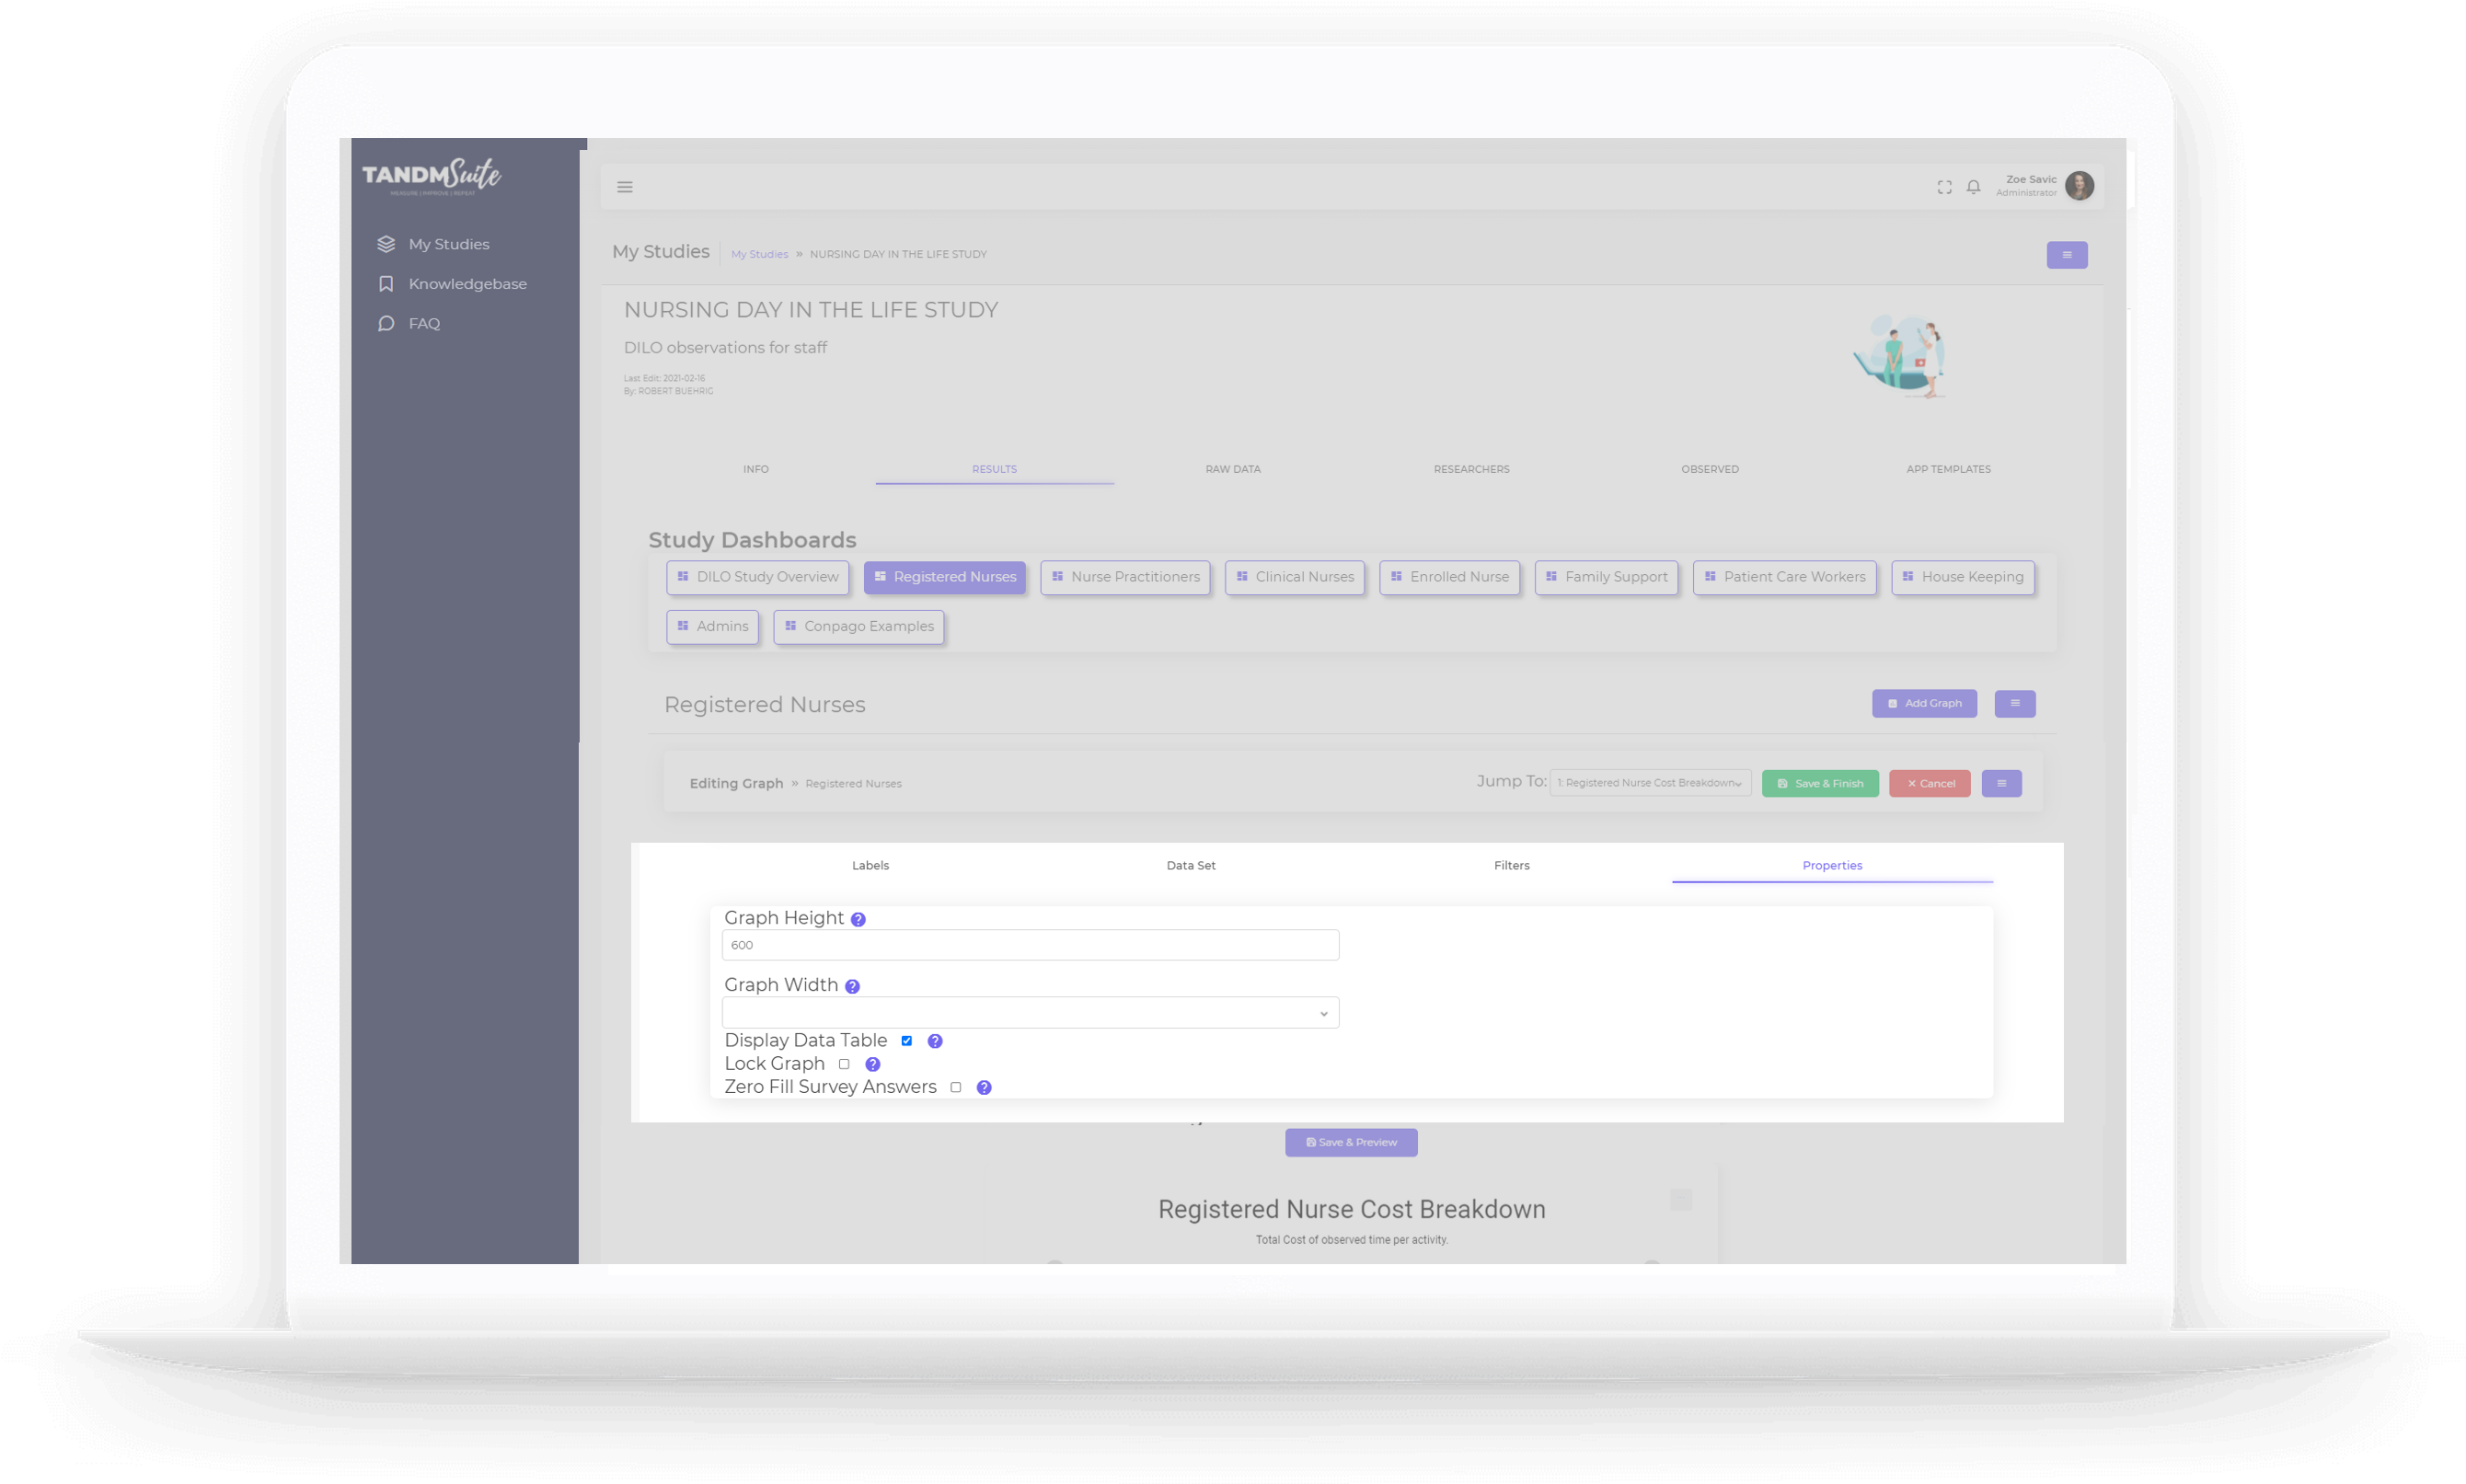
Click the purple Save & Preview button. As the button suggest a preview of your changes will appear below. You can make as many changes and create a preview as you wish.
You can switch to other Edit Graph tabs to continue editing. Once you’re happy with all your changes click the green Save & Finish button.
