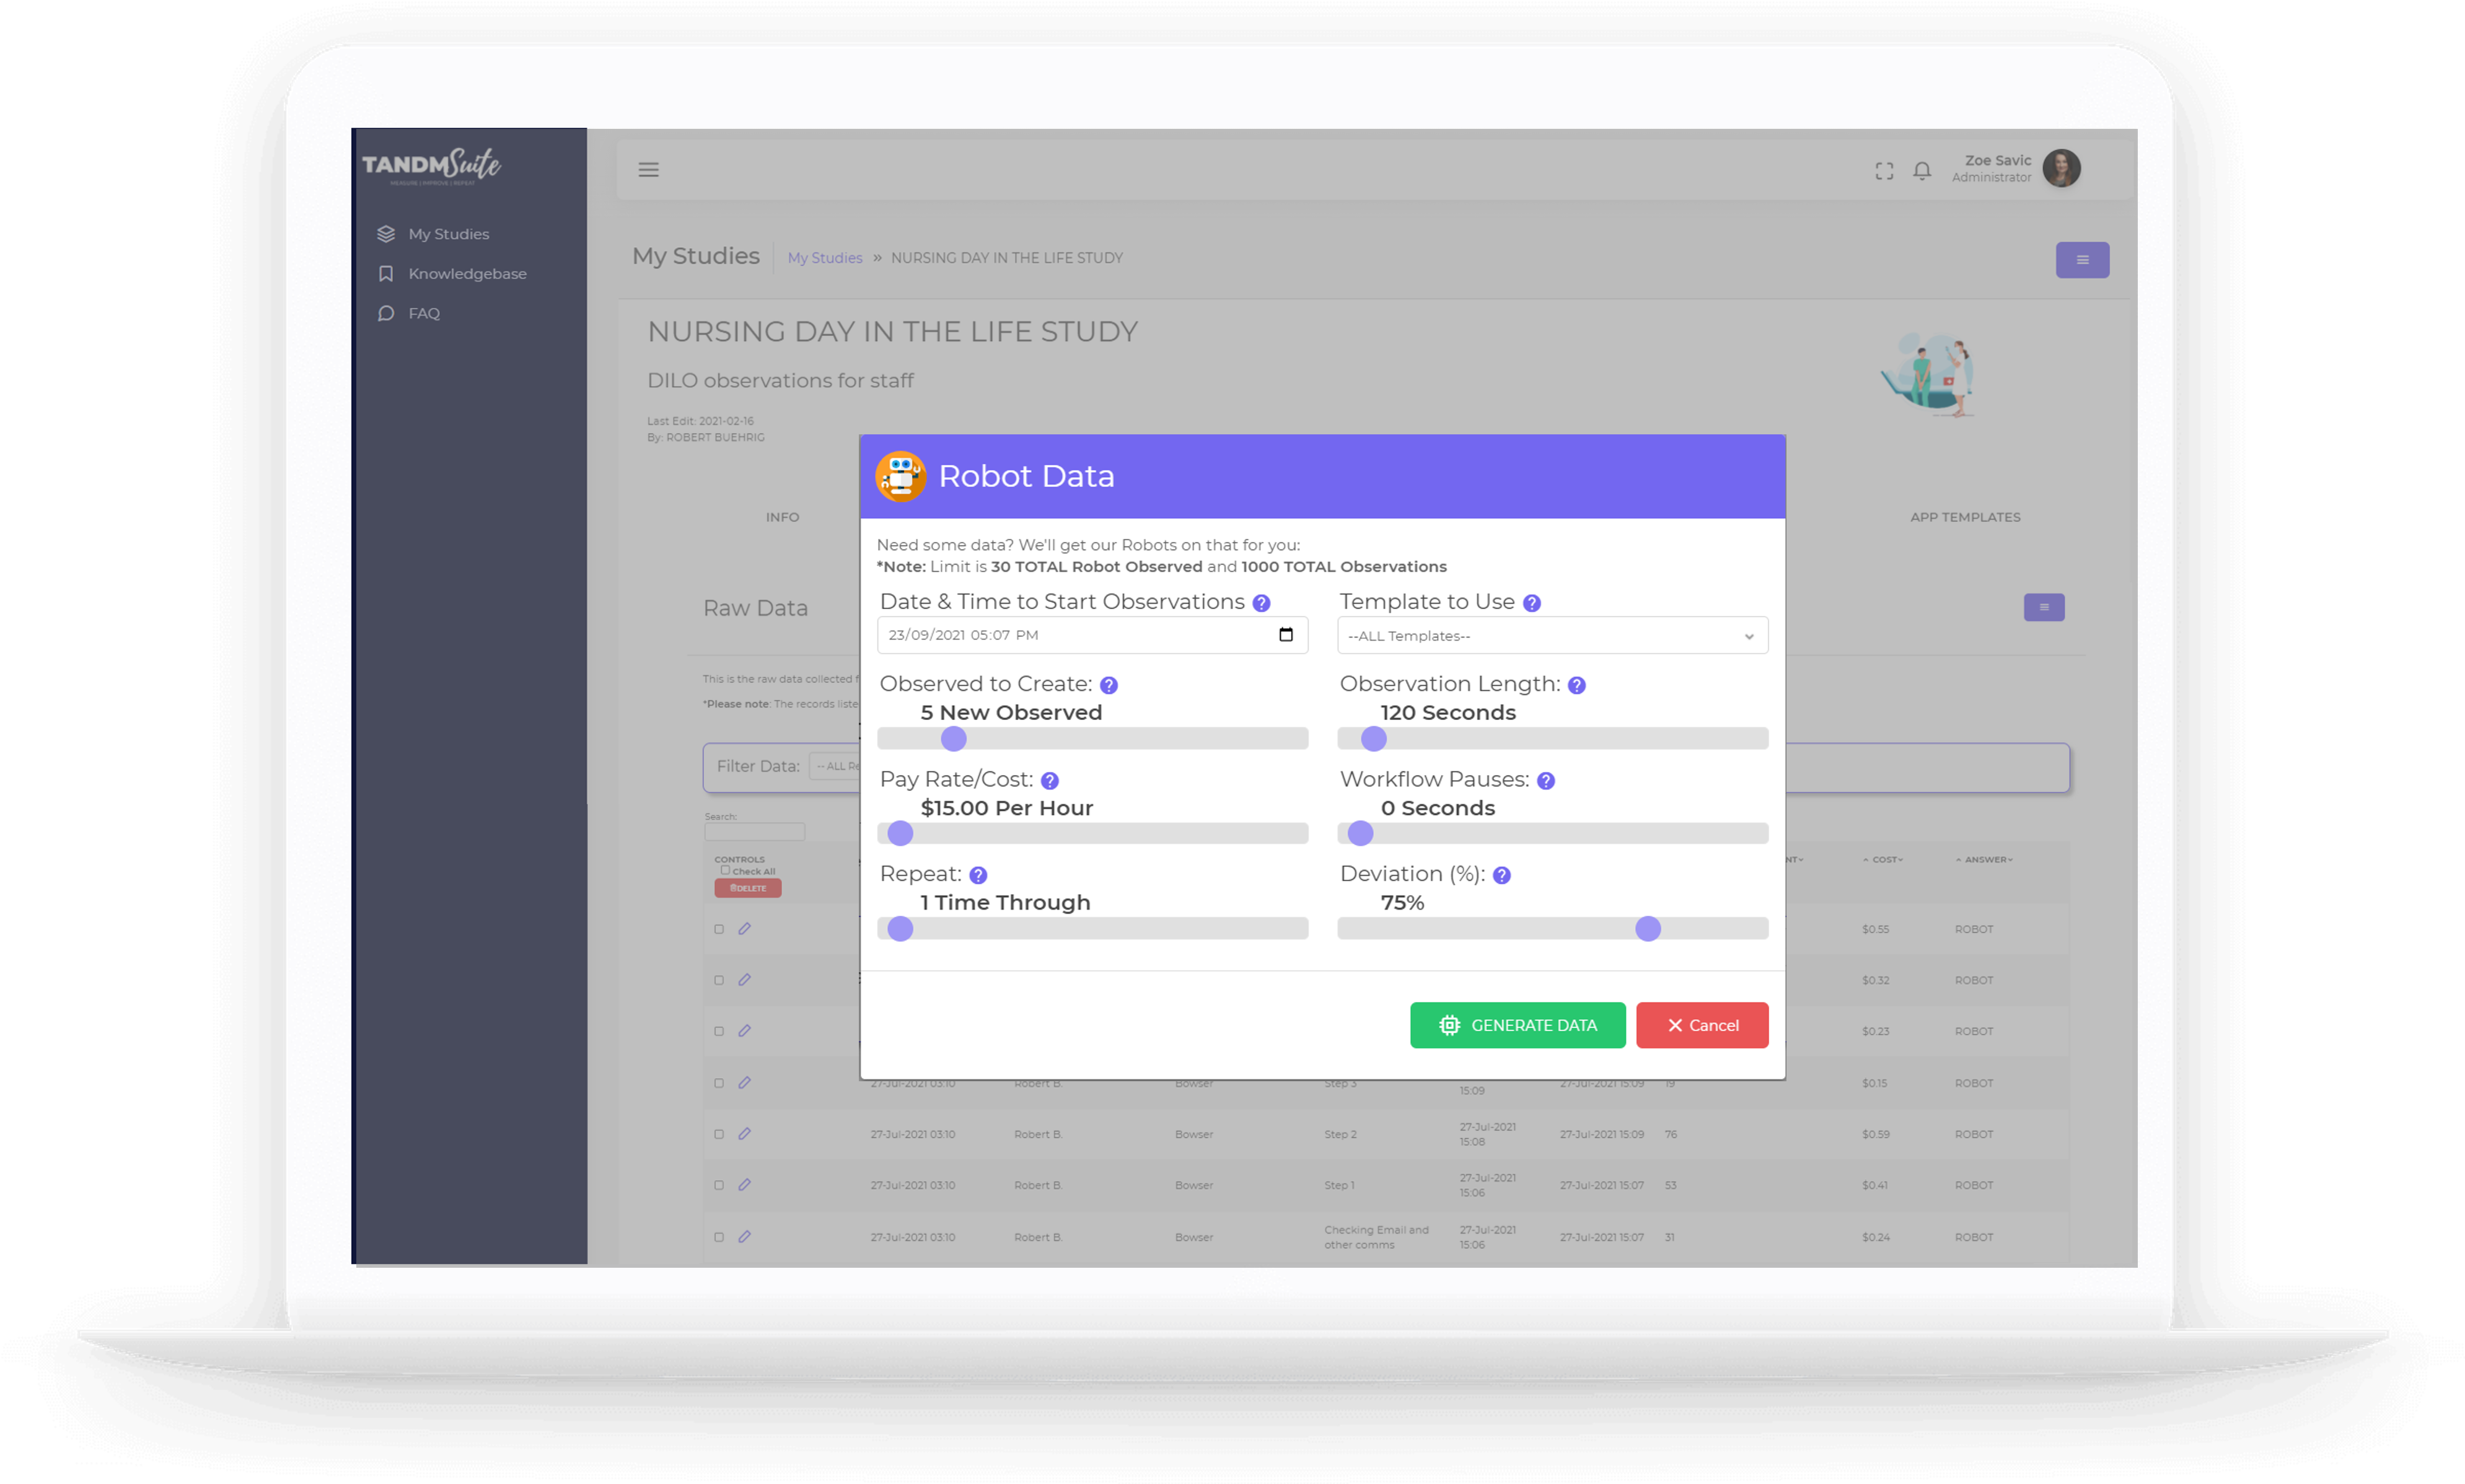
Robot Data is automatically generated when you first build a new study, but that doesn’t mean you can’t generate robot data too!
Navigate to the Raw Data tab and click on the hamburger menu
Click “Generate Robot Data”. This will bring up a settings screen for you to adjust if you wish. They are automatically set with some generic settings which you can apply without change.

Date & Time to Start
This will automatically set to when you open this feature, however if you want to see what graphs would look like with data collected over numerous days you can trigger this feature multiple times, setting a new start date/time for each. Simply click on the calendar icon to select your date/time preference.
Observed to Create
The Robots will automatically create Observed for you, but you can add a larger group of Robots if you need. Simply use the slider to increase or decrease the number as needed. Keep in mind that there is a maximum of 30 Robots.
Pay Rate/Cost
This is a great tool to see what the cost analysis would look like. You may be looking at an hourly rate for employees or a running cost for equipment. Use the slider to increase or decrease the amount as needed.
Repeat:
If you are expecting your real Observed parties (including survey participants!) to participate in your Study more than once, then the Robots can help simulate that as well. Use the slider to increase or decrease the amount as needed.
Template to Use:
You may have more than one Template associated with your Study. This will default to “All Templates”, but if you would prefer the Robots focus on just one Template, then simply use the drop down menu to choose the appropriate Template.
Observation Length:
Set how long you want the Robots to be timed for any Timed Task. Unfortunately this can not be adjusted to be different times for different tasks but use the slider to increase or decrease the amount as needed.
Workflow Pauses:
Most workflows move in rapid succession, but if you know the steps in this process have “gaps” in between you can force a “pause” between steps. Use the slider to increase or decrease the amount as needed.
Deviation %:
The Robots are pretty smart and realise not everything goes according to plan. They will use the Observation length and Pauses you’ve defined and randomly shift those numbers up/down by the Deviation % you set. Use the slider to increase or decrease the amount as needed. If you do NOT want deviation, just set it to 0.
Once you’re ready to proceed click on the green “Generate Data” button. You will be able to see the Robot Data marked in the Raw Data tab as “Robot” in the Extra column.
Note, we don’t have an endless supply of Robots and you will be capped at 30 Robot Observed and 1000 total Observations. Remember this tool is simply to give you an understanding of what your graphs will look like before you collect data.
When you’re finished playing with the Robots you can click on the hamburger menu once more and click on “Delete Robot Data”.
A warning message will appear at which point you can cancel or confirm the action by clicking the Delete button.
We promise, no robots will be harmed during the process.

