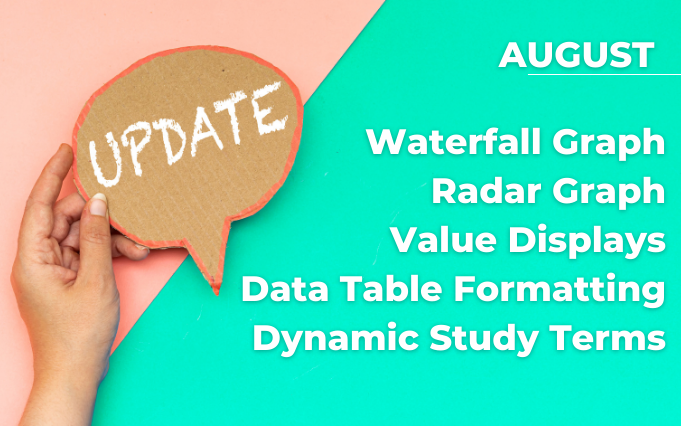
See whats new inside the TANDM Suite with our latest software updates.
TYPE: NEW
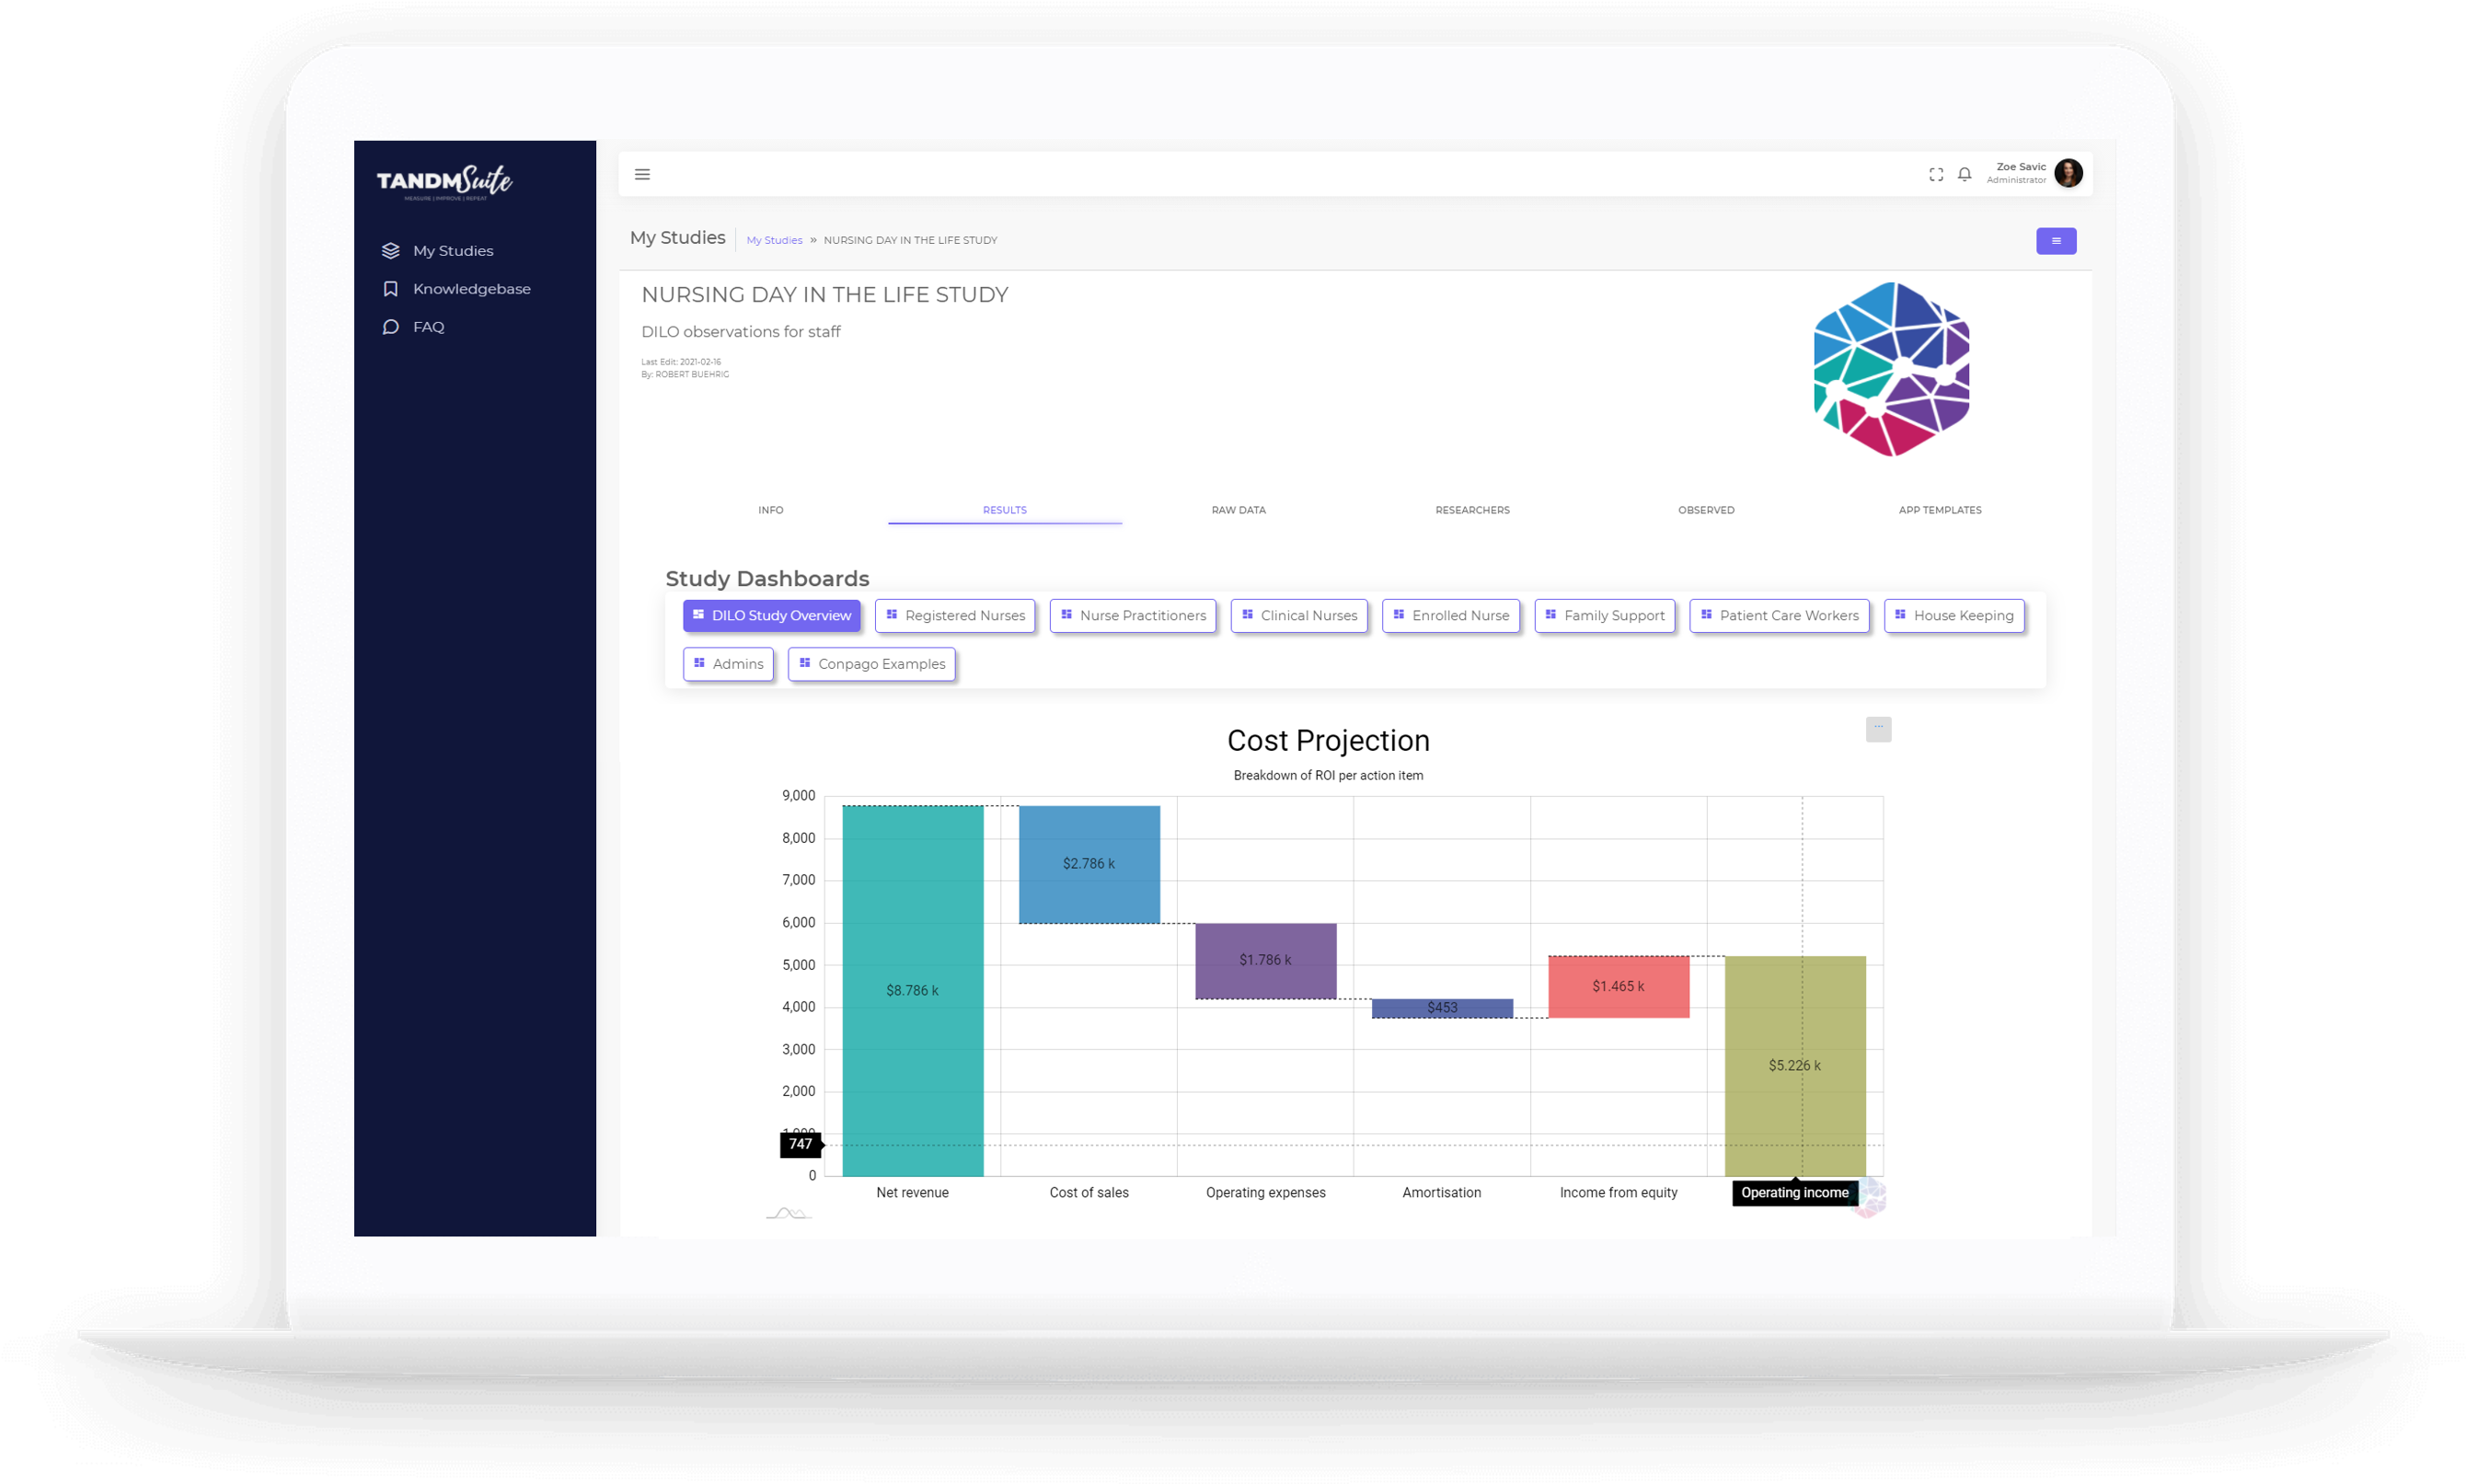
WHERE IS IT: Results tab – Add Graph -> Waterfall Chart
FEATURE: New Graph Type: Waterfall
SUMMARY: TANDM Suite now supports Waterfall charts
WHY IT MATTERS: Waterfall charts are unique in TANDM Suite because they are used for predictions, not for measuring current data. Waterfalls are great if you know where you are and have a series of steps to get to where you want to be. Just add the step and the value to the setup and the Waterfall chart will show you which steps are going to set you back and which will propel you towards your goals!
TYPE: NEW
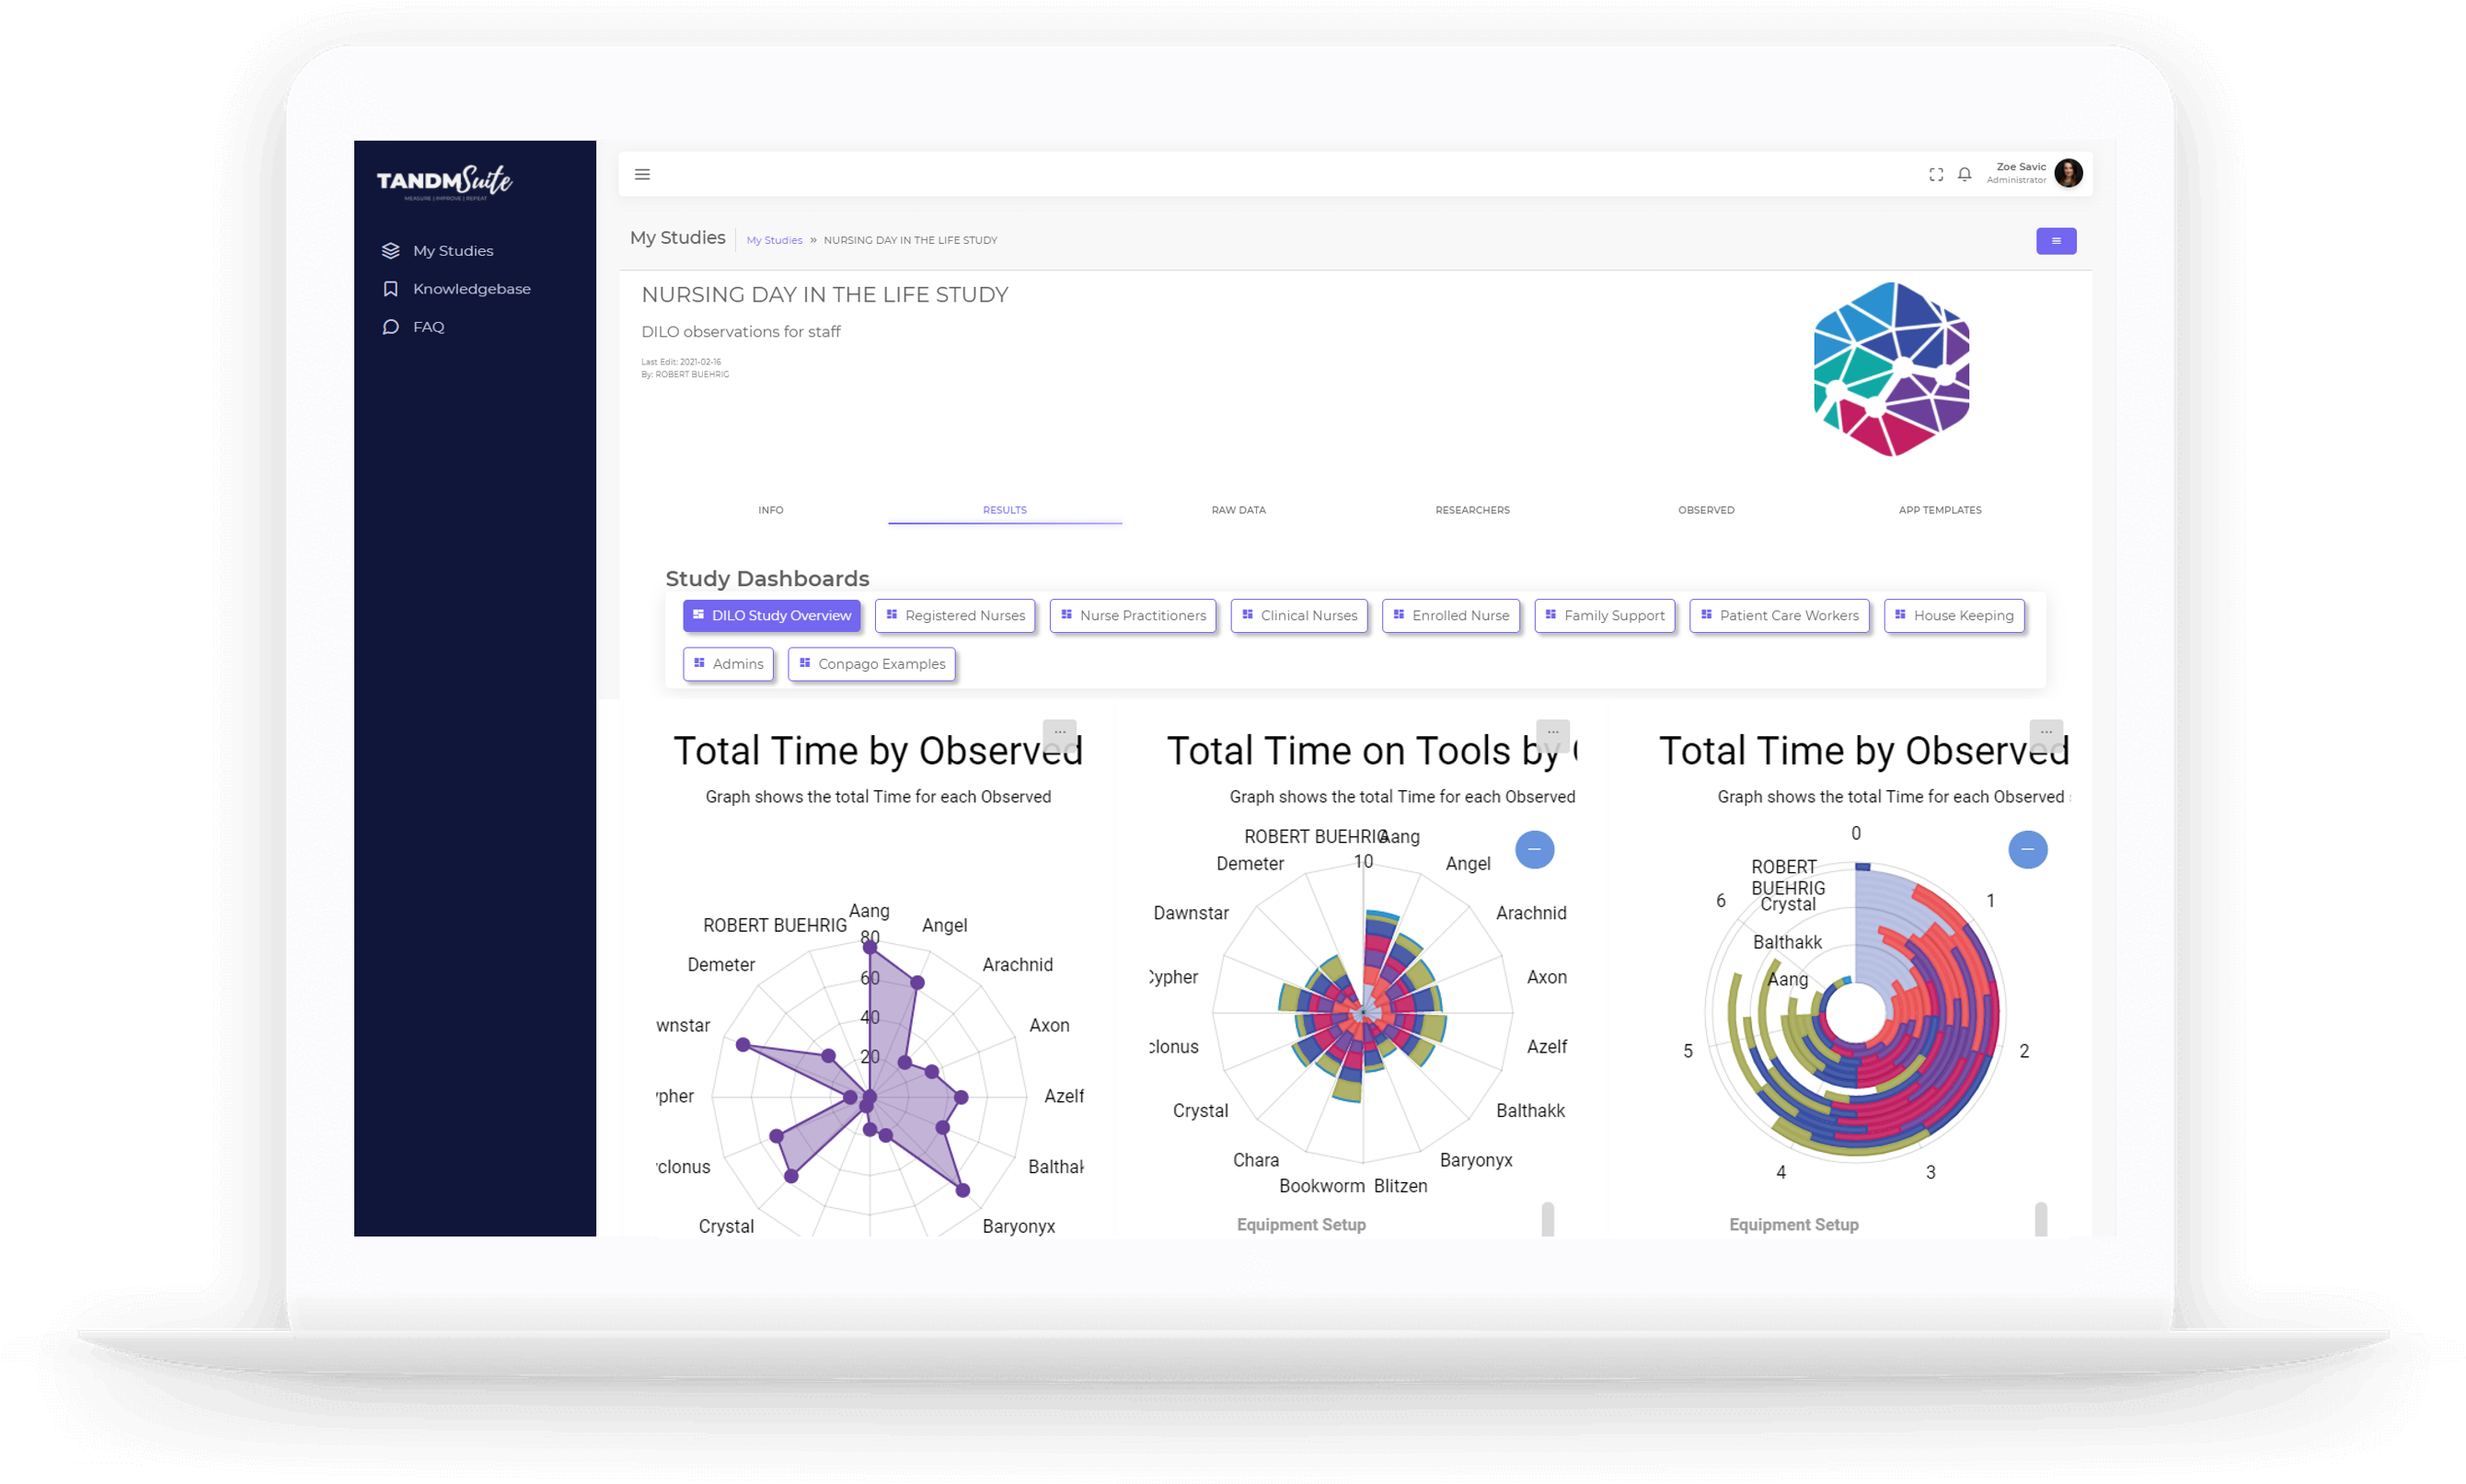
WHERE IS IT: Results tab – Add Graph -> Radar Chart + Radar Stacked Chart
FEATURE: New Graph Type: Radar
SUMMARY: TANDM Suite now supports Radar charts
WHY IT MATTERS: Radar charts are a great spin on the classic bar chart, allowing you to see items as a radius from a centre instead of bars. Chose between the regular radar chart or the stacked radar chart to display your data. For ‘Pro’ licenses, check out the properties section in Edit Graph to access the SPIRAL feature!
TYPE: NEW
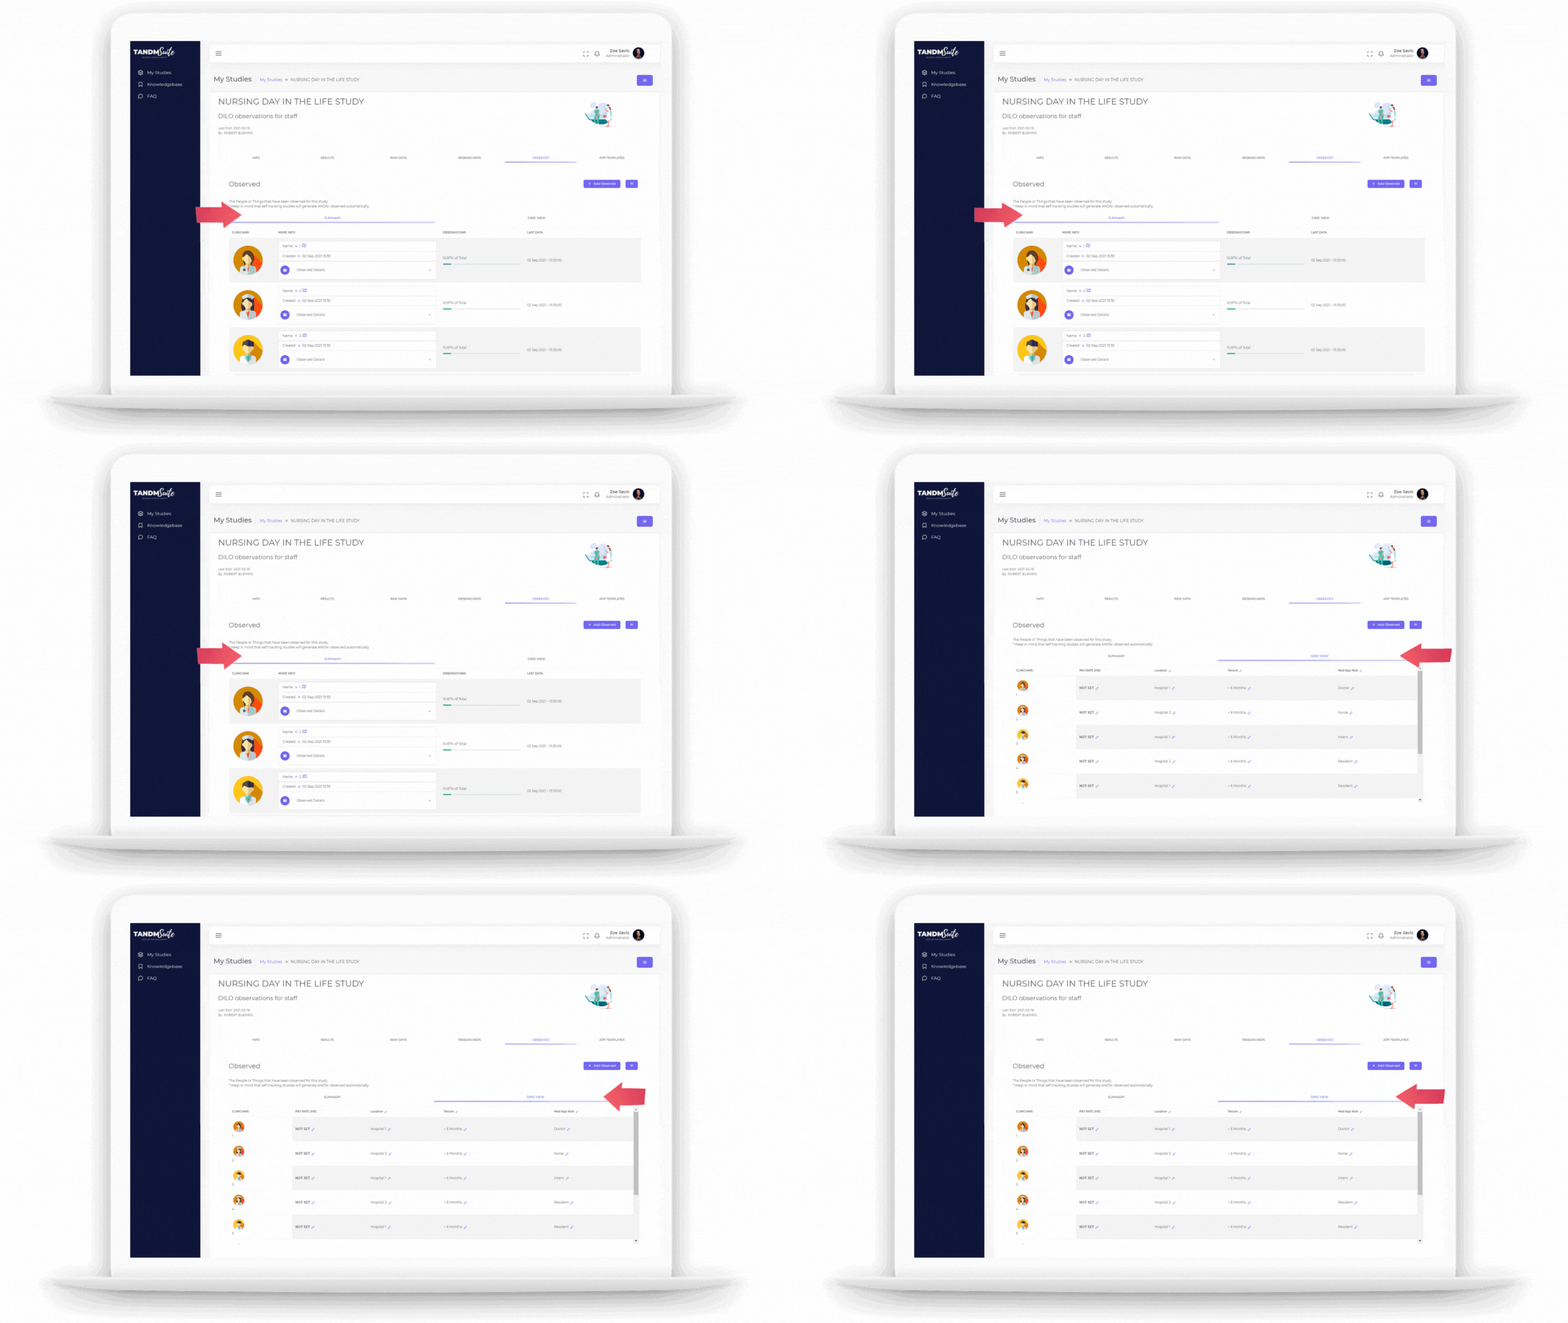
WHERE IS IT: Observed Tab -> Grid View
FEATURE: Grid View for reviewing Observed Info & Details
SUMMARY: Grid view introduced for easy review of Observed Details
WHY IT MATTERS: When you start to get more than a handful of Observed or Details then it gets very tedious to update all of those if you need to. The new Grid view features frozen panes, inline editing, and is the fastest way to maintain the information about your Observed in the Study. Don’t worry, you’ve still got the pretty table layout that you’re used to as well!
TYPE: Enhancement
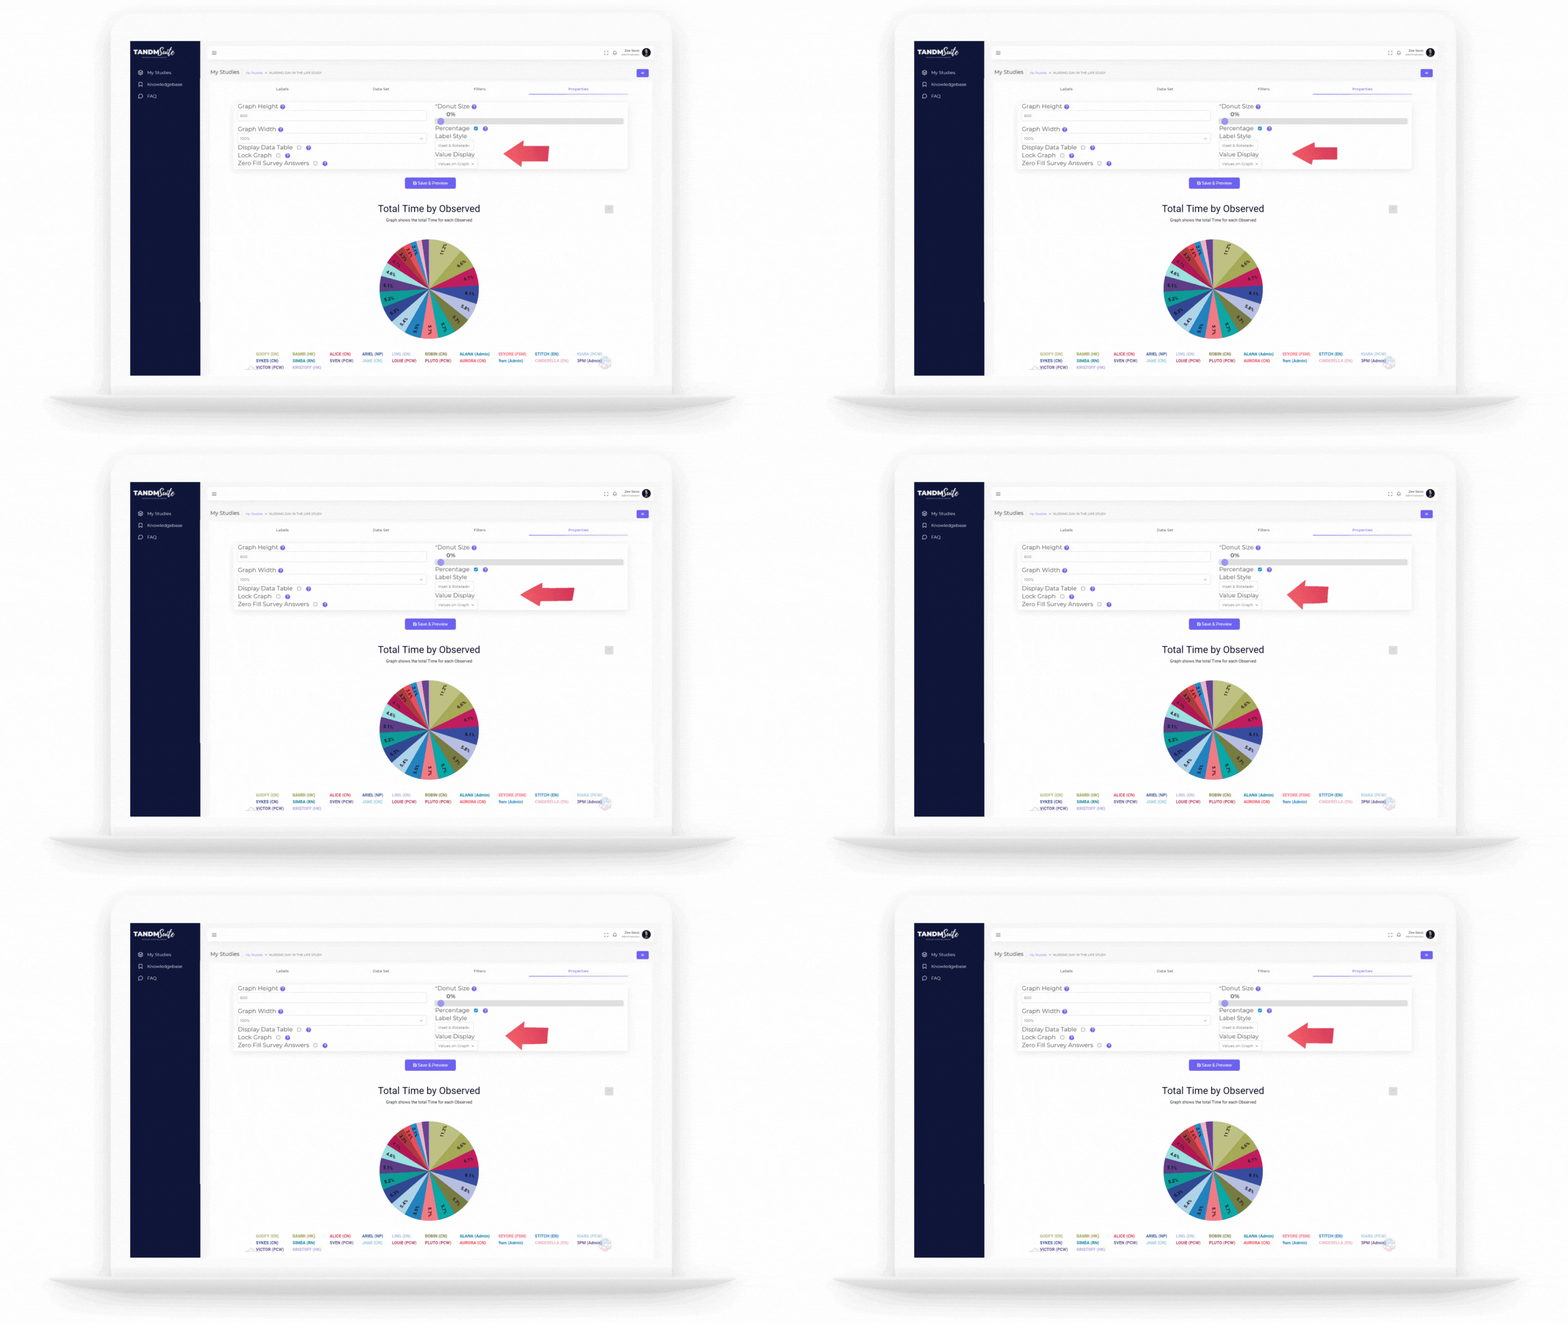
WHERE IS IT: Pie Chart -> Properties Tab
FEATURE: Value Display Setting
SUMMARY: Pie chart labels can now be configured to display on the slices, on the legend, or both
WHY IT MATTERS: Your charts are all about how you want them to look and feel. This simple change lets you see your pie charts the way you want them! You should try out the Label Style setting as well, it lets you change where the labels sit on the slices themselves!
TYPE: NEW
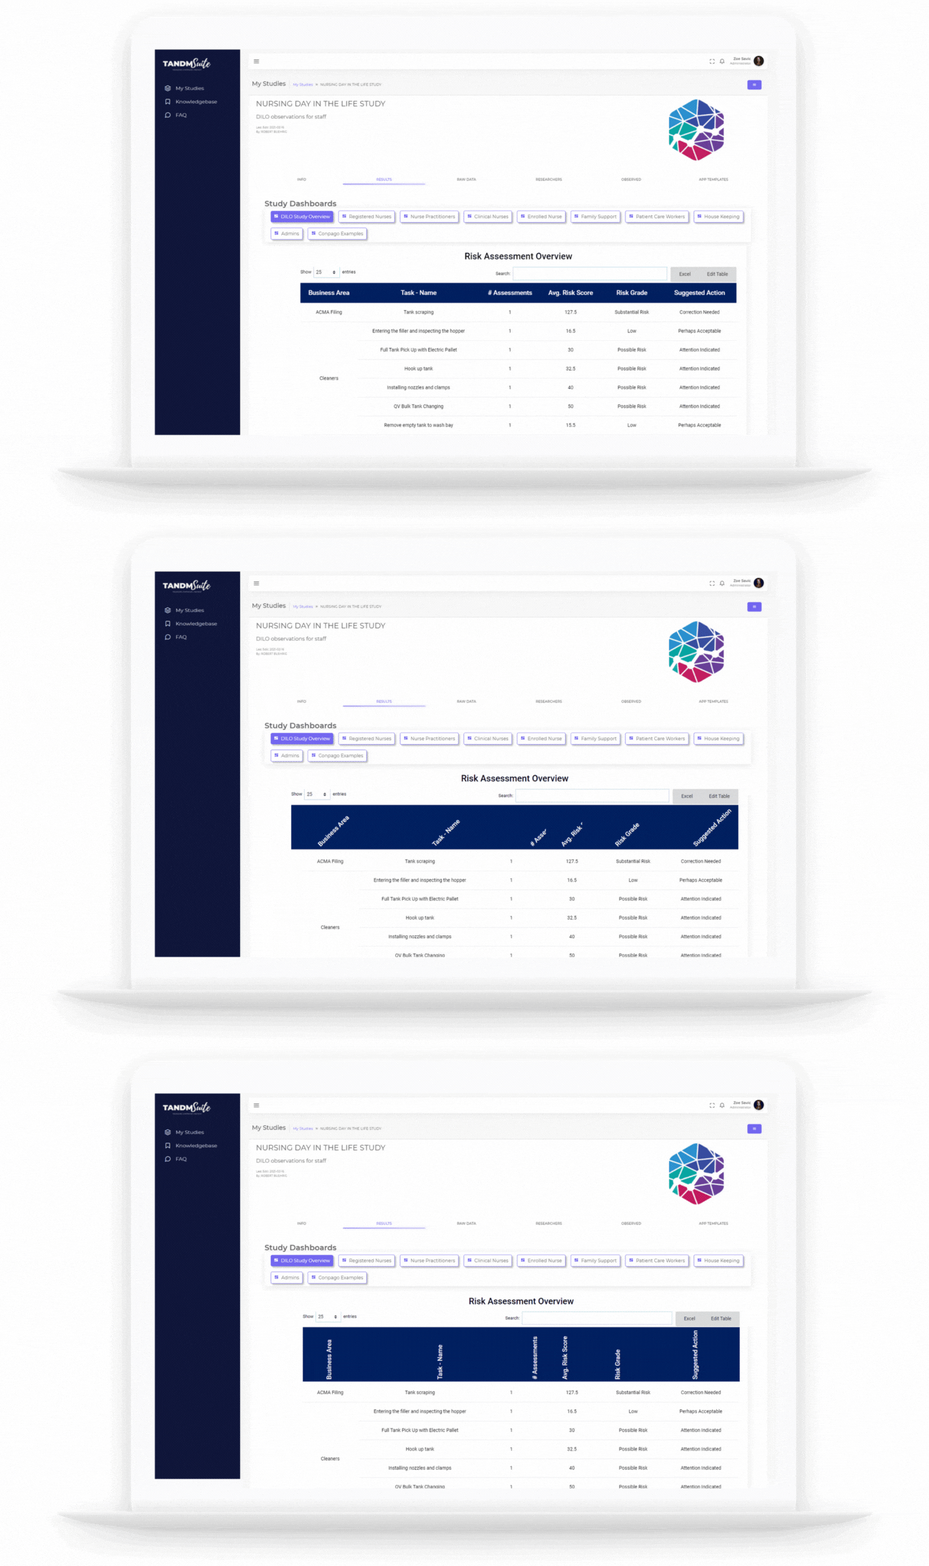
WHERE IS IT: Restults Tab – Data Tables-> Rotate Headers
FEATURE: Rotate Headers on Data Tables
SUMMARY: Now your Data Tables can rotate the Headers to 45 or 90 if that suits your data
WHY IT MATTERS: When your Data Table is filled with small numbers it’s often better to rotate the headers so you get that dense Heatmap feel instead of having your headers spread out your Data elements. This setting persists into the Excel Export as well!
TYPE: NEW
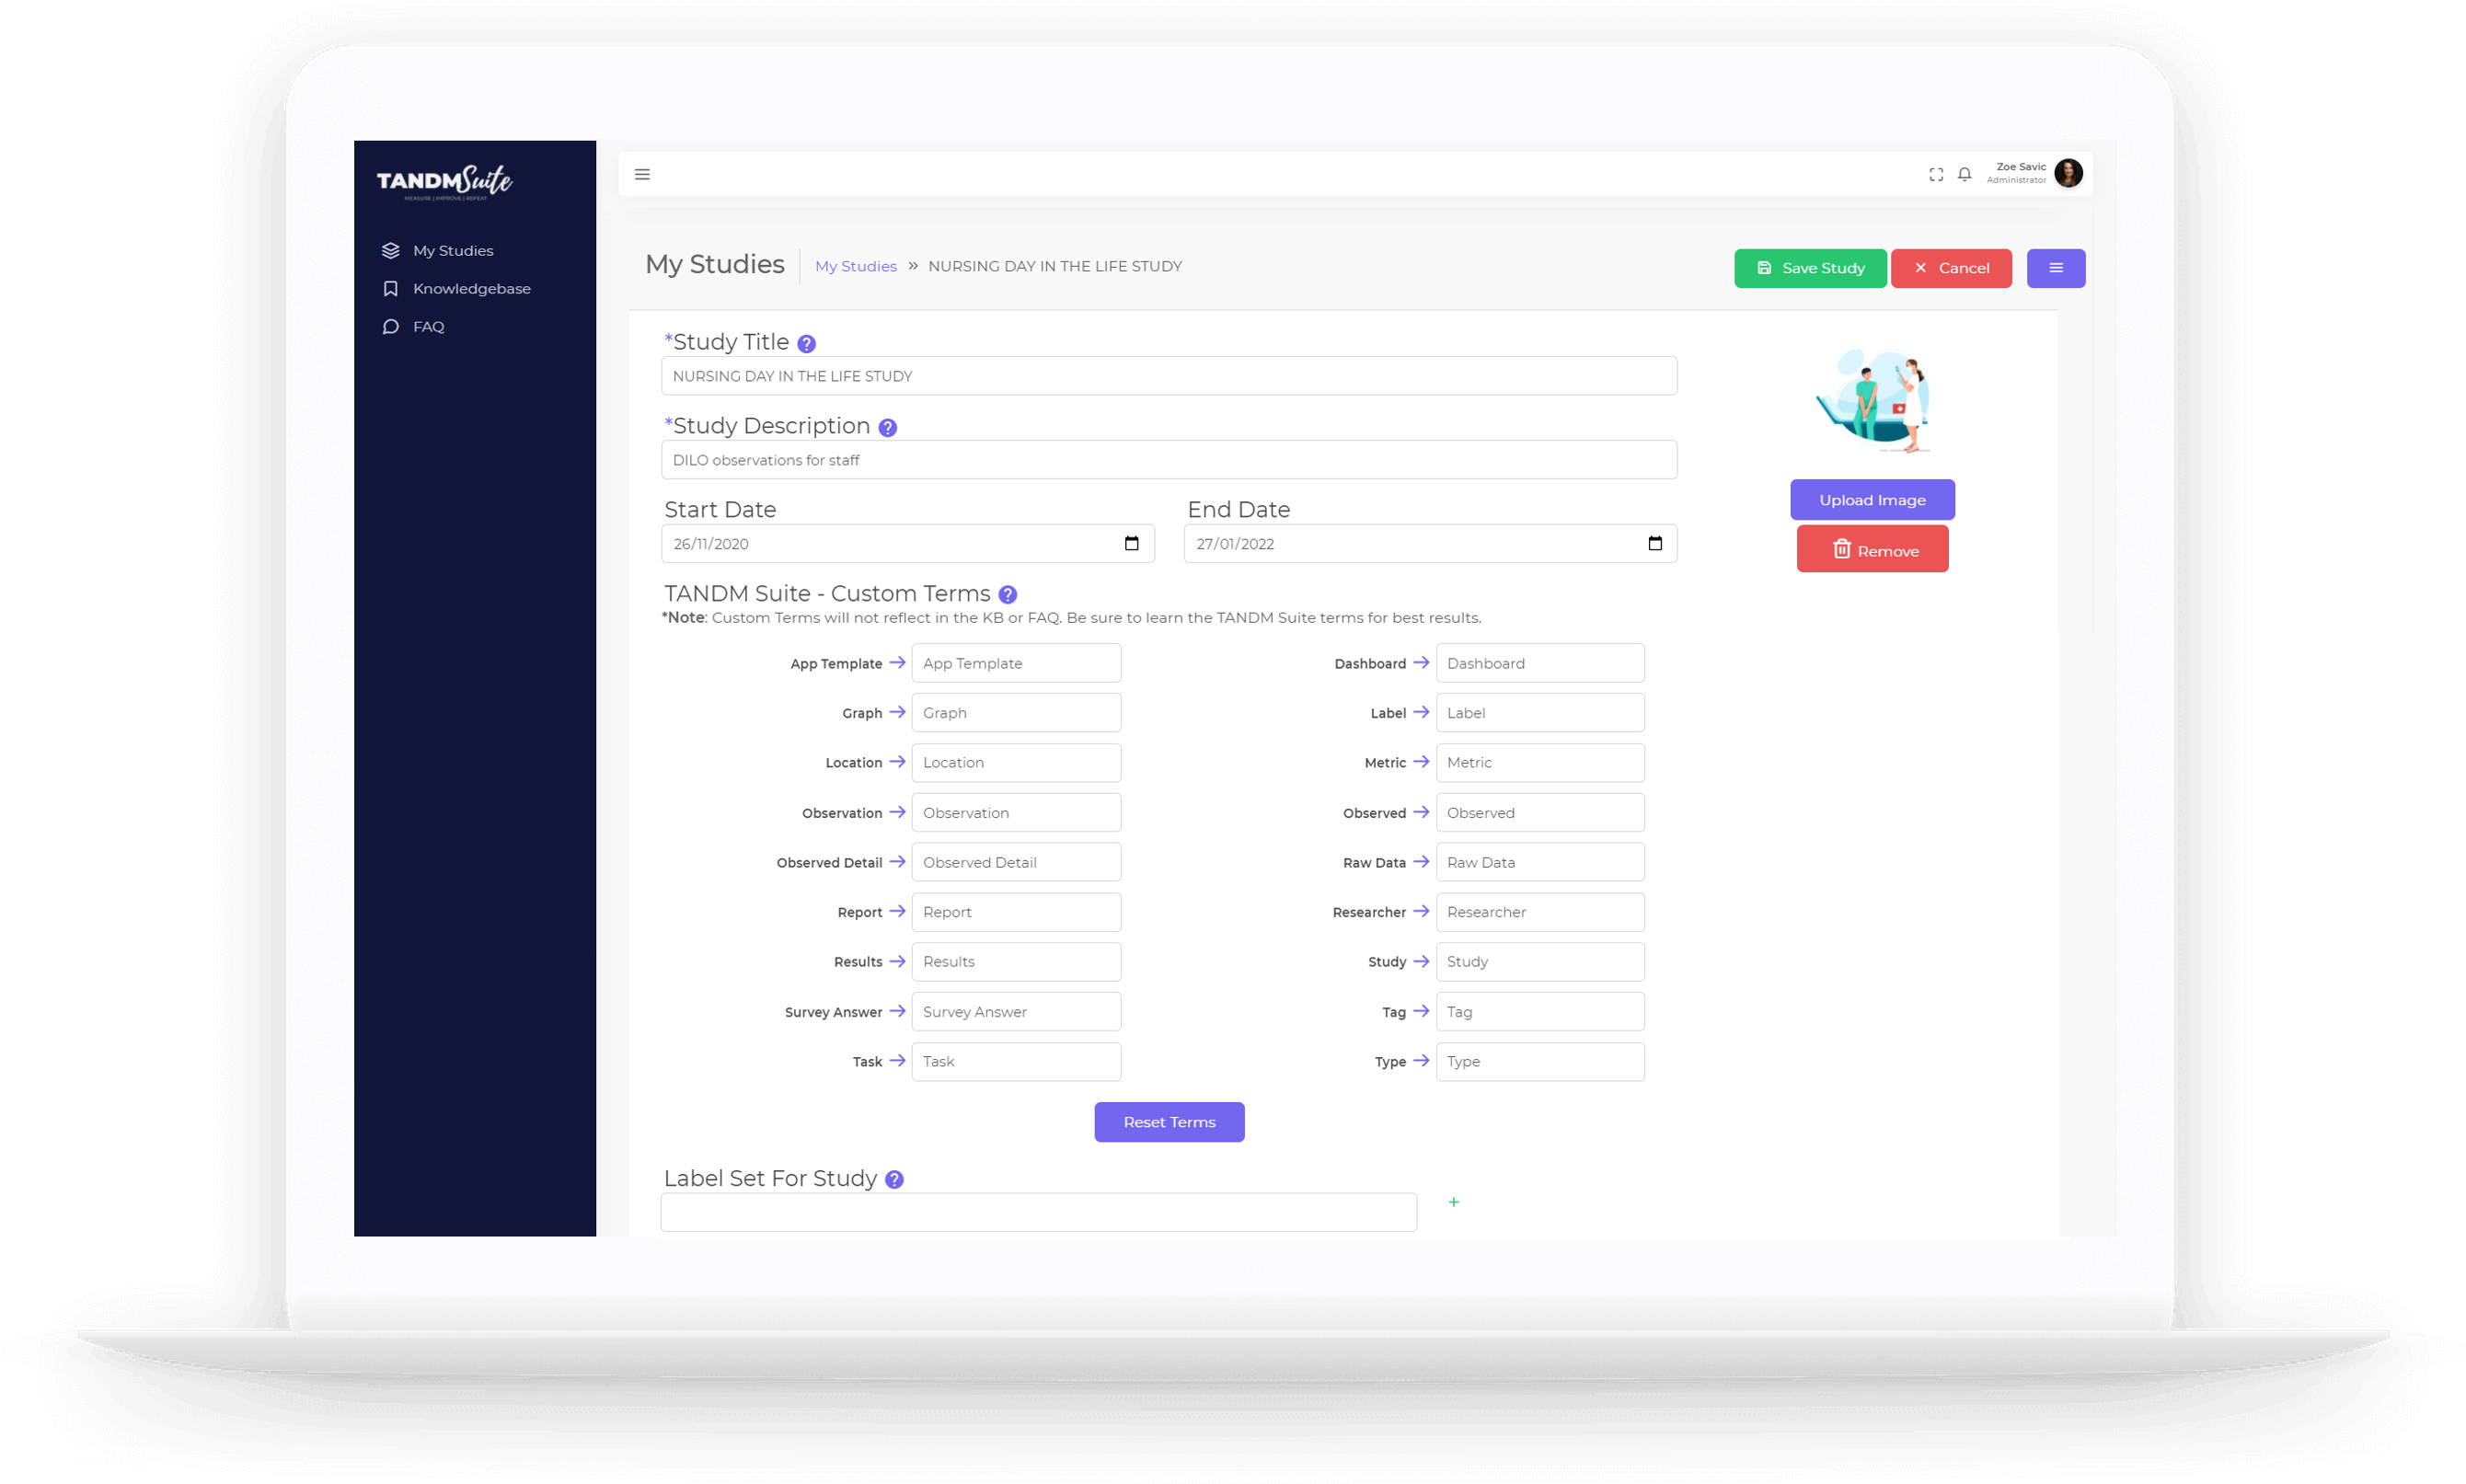
WHERE IS IT: Edit Study -> Study Terms
FEATURE: Dynamic Study Terms
SUMMARY: TANDM Suite terms (Observed, Observation, Researcher, etc) can now be replaced with more precise terms
WHY IT MATTERS: A long time challenge for TANDM Suite is that it’s built to be a one-stop-shop for any workflow analysis, but that can be distracting when we’re using generic terms instead of terms specific to what you are doing. Now you can replace most Terms with what makes sense for you from the Edit Study setup. Observed could be changed to “Patient” and Researcher to “Associate” as you see fit! Just remember this only works while INSIDE your Study, the KB and Help pages will still reference the original TANDM Suite terms!
TYPE: Enhancement
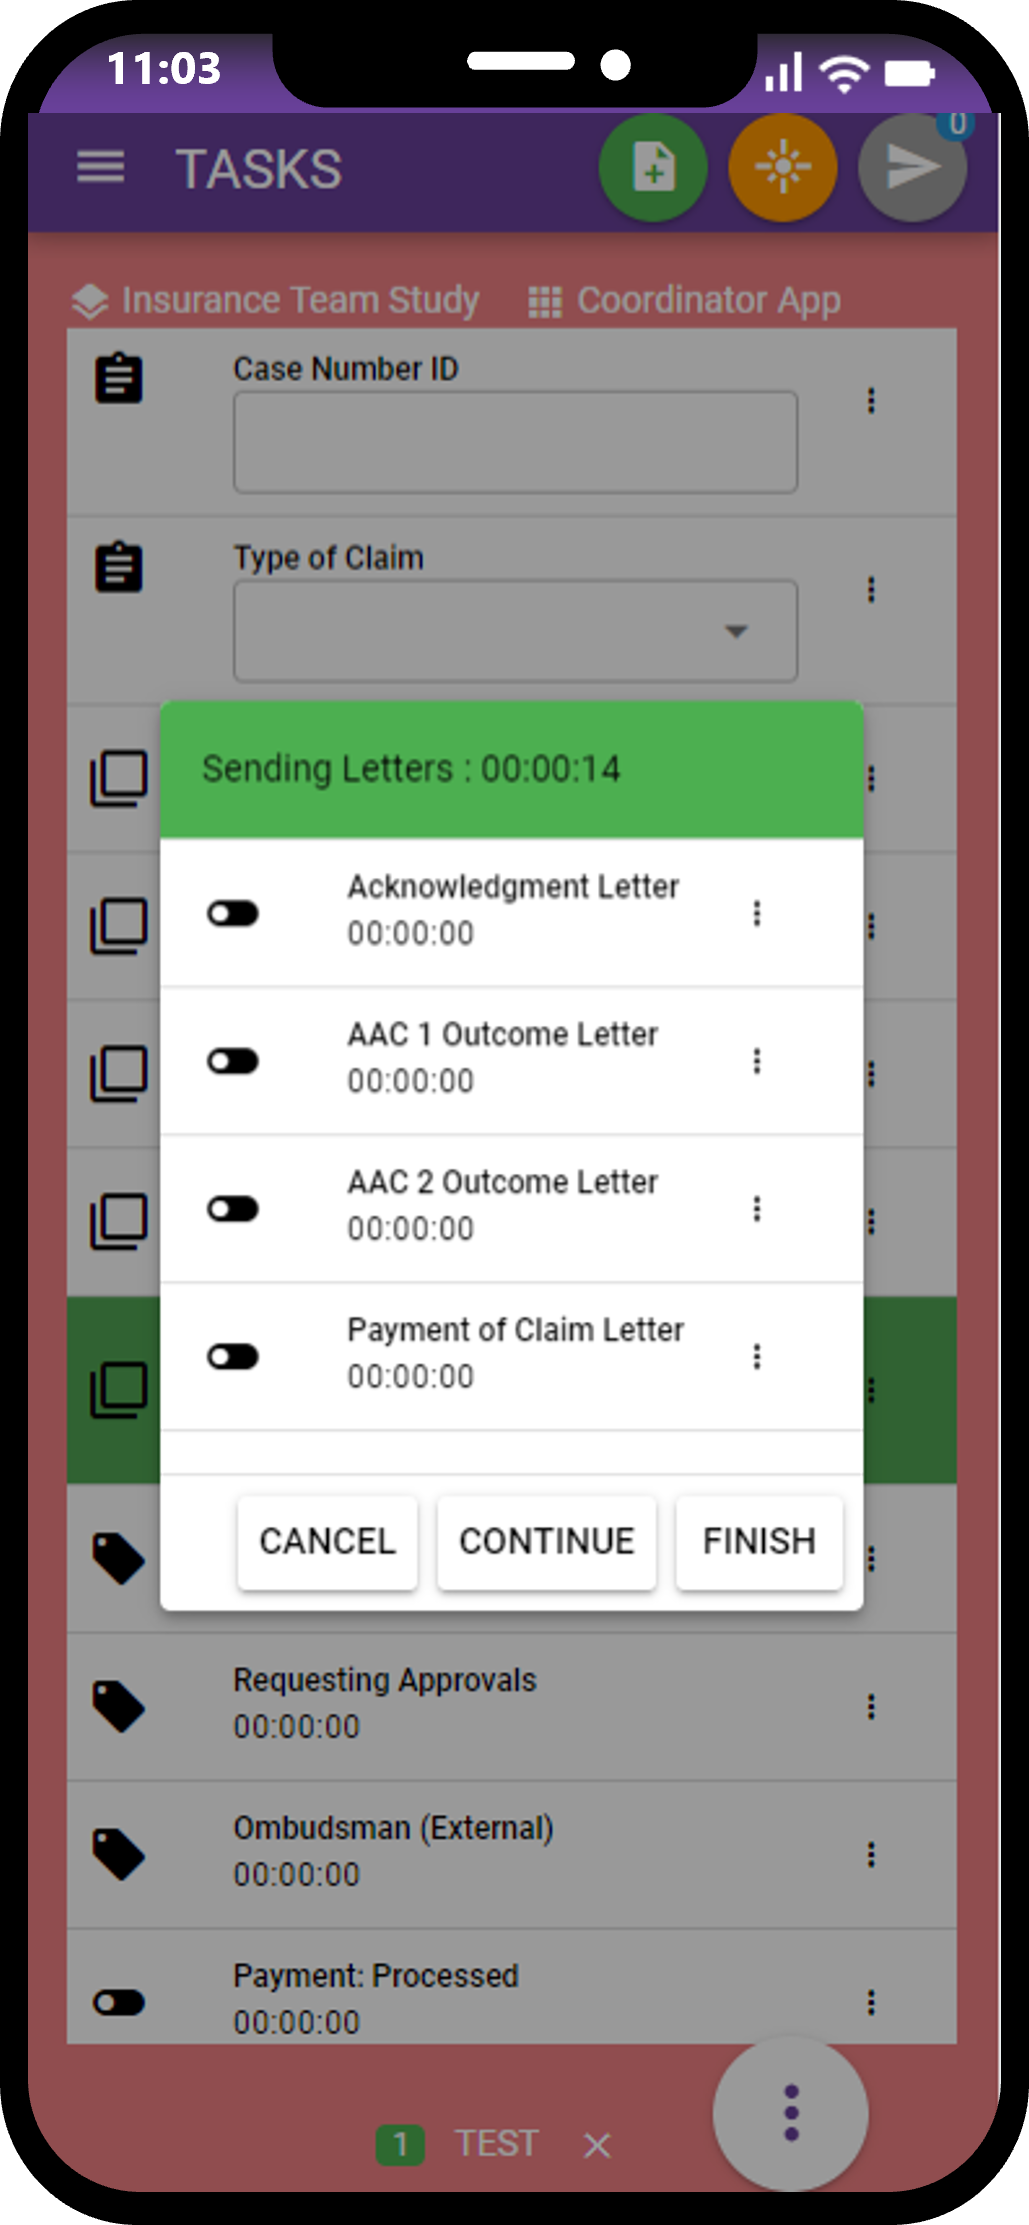
WHERE IS IT: Edit Template -> Popups
FEATURE: Popups can now contain Group-Timers
SUMMARY: Group Timers can now be included inside of Popups
WHY IT MATTERS: A ‘Popup’ is a collection of tasks that data can be collected on and a ‘Group Timer’ allows you to record a period of time for a series of tasks / events that only occur one at a time. Now these two features work together to make collecting data on your workflow even easier!
TYPE: Enhancement
WHERE IS IT: Raw Data -> Import
FEATURE: Importing Data now supports Duration or Start/End time data
SUMMARY: Excel Import of Data now supports Timer data in addition to Tag/Value pair data
WHY IT MATTERS: We’ve expanded more on our Import data to allow Timer information to be imported directly from any excel source using our field mapping import. For those of you with LOTS of data, we’ve also enhanced the import process to be faster than before!
TYPE: Enhancement
WHERE IS IT: Edit Template
FEATURE: App Preview follows you
SUMMARY: The App preview now scrolls with you as you build your Template
WHY IT MATTERS: What’s the point of a preview if you can’t see it after you build 5 things? Now it will stick with you so that you know what your result will be regardless of how long your Template is.
TYPE: Enhancement
WHERE IS IT: All Charts
FEATURE: Logo Cleanup
SUMMARY: The Charts have reduced Cogniom logos
WHY IT MATTERS: We really want your data to speak for itself, so we’ve reduced the number and size of watermarks to allow your data to shine!
TYPE: NEW
WHERE IS IT: TANDM Pro -> Passthrough Authentication
FEATURE: Launch TANDM Pro and skip the login process
SUMMARY: Launching PRO Templates from the Admin bypasses the login if launched from the Admin
WHY IT MATTERS: Since in the Admin you’ve already logged in once, why make you login again? This feature passes a key to allow you to get straight into your Pro Template without having to enter your username and password again!

