Get Real Time Results.
It is one thing to be able to collect information and insights, and quite another to turn that data into meaningful results.
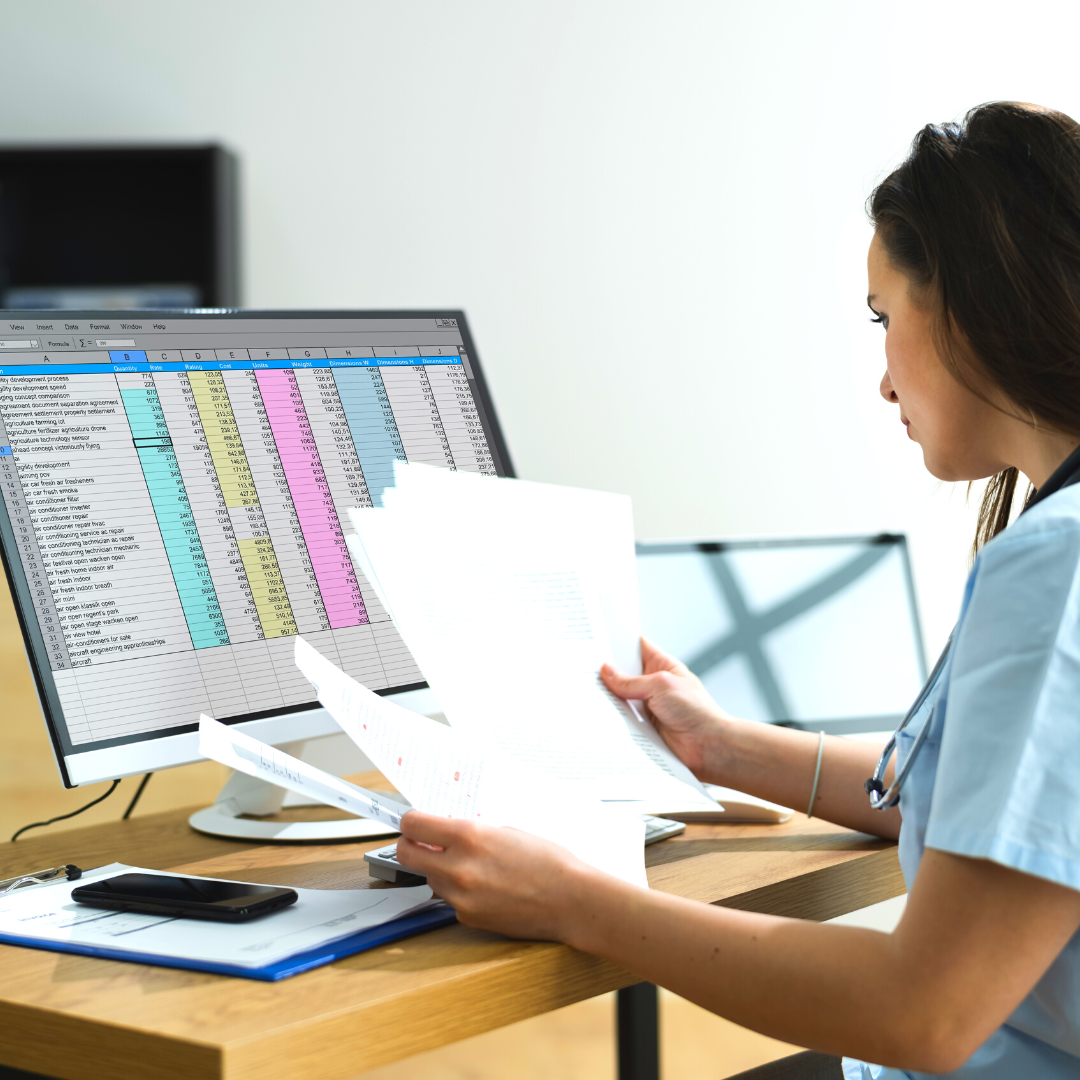
Existing methods of data collection and analytics are hindered by the reliance on manual labour, often making the project expensive both in time and cost. With the additional burden of labour and cost, these projects can often be abandoned or not deemed viable from the beginning.
How many opportunities have been missed because building analytics and achieving meaningful results landed in the ‘too hard’ basket?
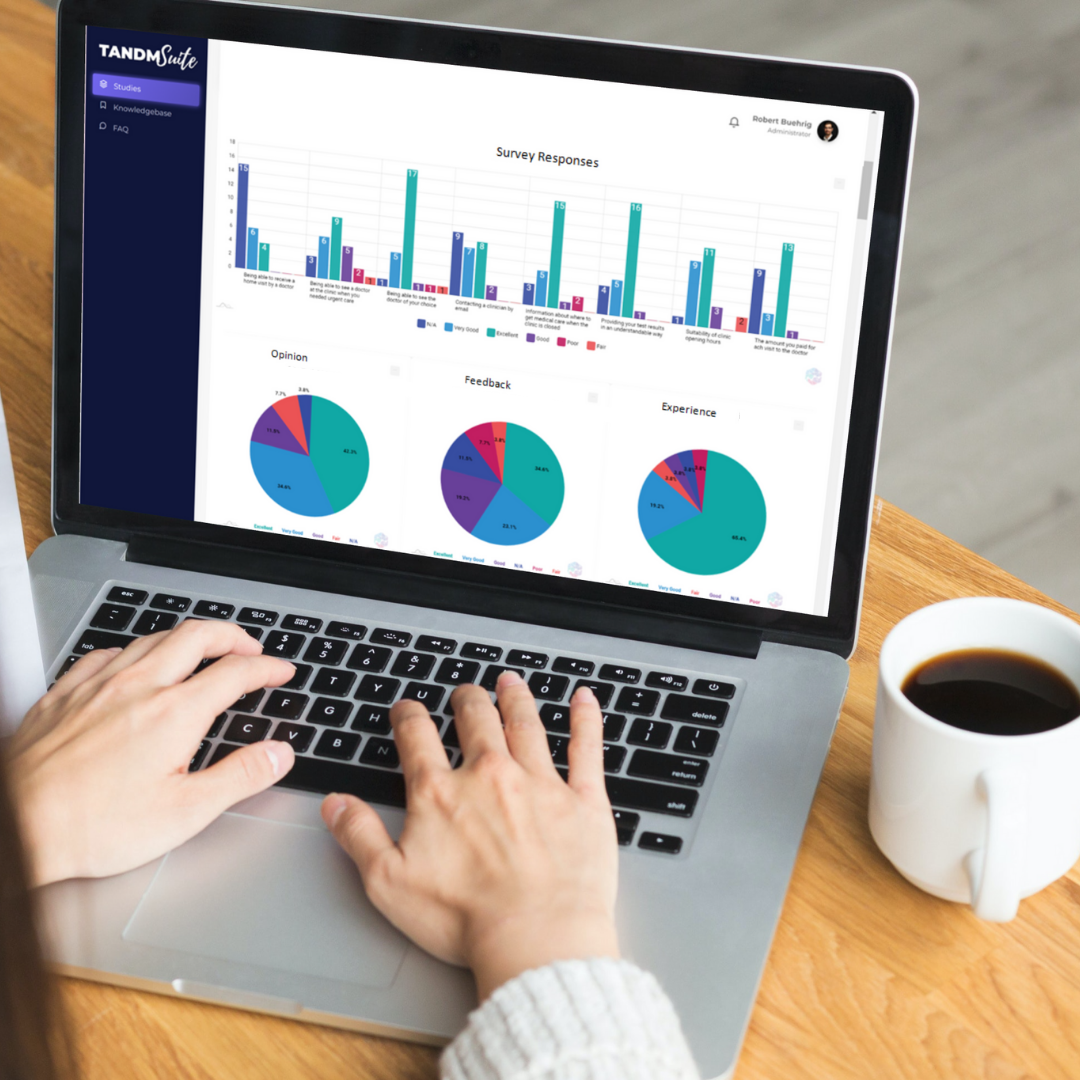
The TANDM Suite uses “robot data” to allow you a preview of what results will look like, providing the ability to make sure your project will collect ALL areas of information you need.
When the Graphs and Dashboards already set up, results will begin to populate as soon as data is received allowing you to take action the moment the data collection phase is complete. Compared to the many months of drawn out.
Data is clean, usable and integrity in tact meaning you can act.

Robot Data
Use Robot Data to preview your analytics before collecting data to ensure your results will display the right information.
Preview Graphs
Build your graphs before your project kicks off so results populate as soon as data is synced.
Graph Builder
Easily build graphs to display time or cost, filtered to specific data points and customisable to size and colour specifications.
Real Time Analytics
With your Graphs pre-prepared analytics will display as soon as data is synced from your researchers. No more waiting until the end of the project to see results!
Colour Properties
Set colour preferences to suit your needs. Use brand colours, create colour uniformity across data sets and take advantage of patterns and grescale features for publication requirements.
Label Sets
Researchers can add labels to collected data from a preset list, ensuring uniformity with data collection and additional layers of analytics that can be presented.
Public Dashboards
Share your results to a wider audience by making your dashboards public, saving time in downloading an saving individual graphs.


