Think of your Study as the
container that holds all the information of your
project together.
Here you will find:
– Info
– Results
– Raw Data
– Researchers
– Observed
– App Templates
Info
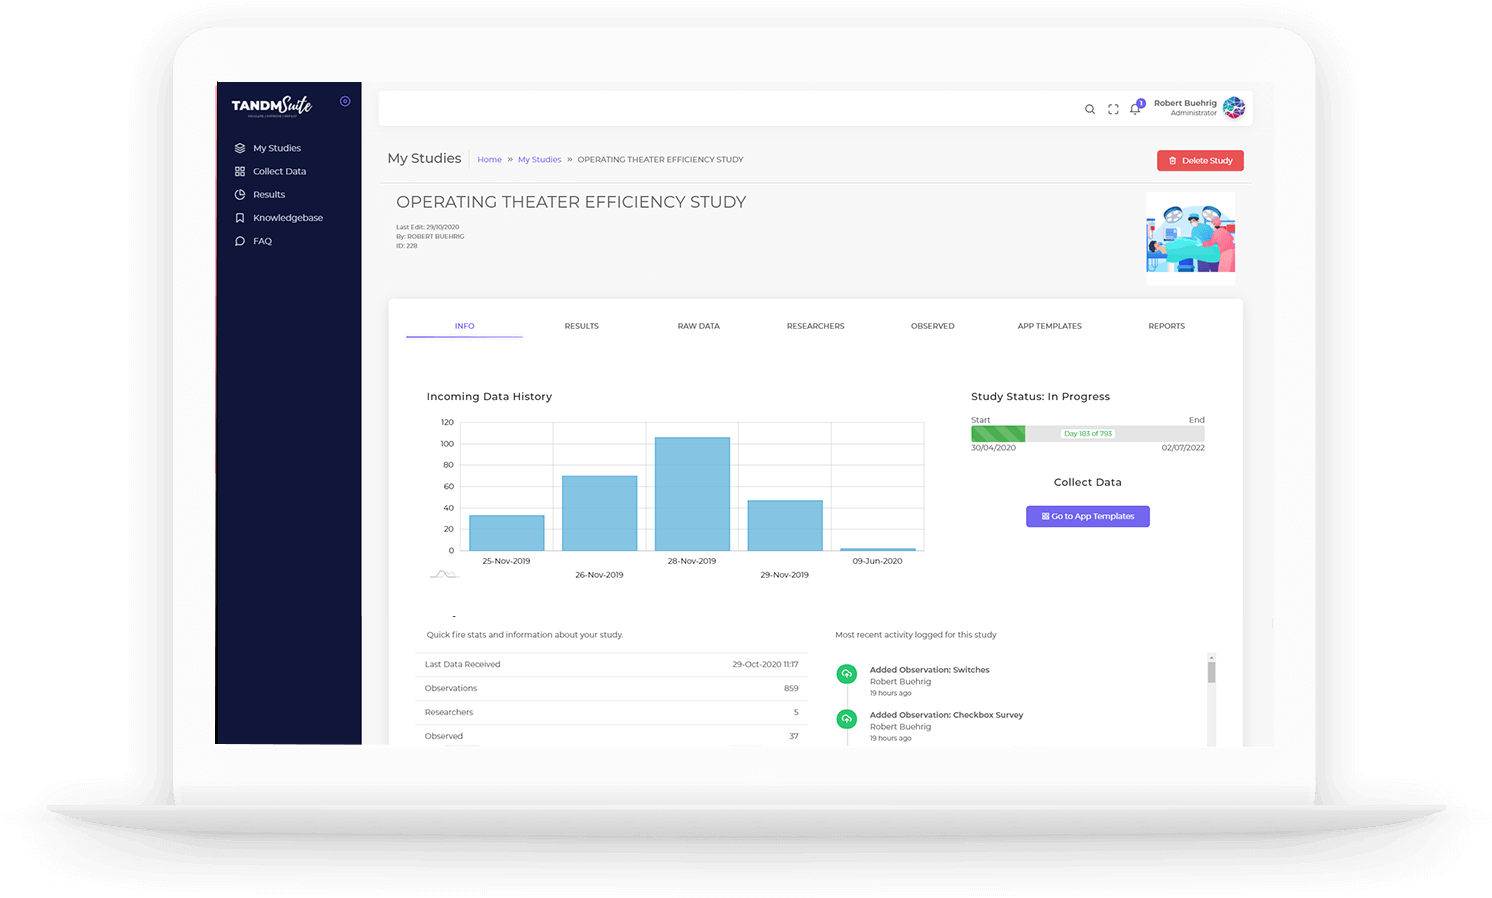
Incoming Data History | Displays the overall volume of incoming data per day. Use this to gauge how much activity your researchers are sending in overall.
Study Status | A progress bar to see how far along in your project you are. See Editing in TANDM on how to changes these dates.
Collect Data | If you have a single App Template associated with your Study this purple button will enagle you to “Launch” your App Template. If there are multiple, it will show you “Available” App Templates and direct you to that page.
Study Information | A quick fire stats and information table about your study.
Study Activity | This is an in depth chain of evidence for all updates and activities performed by all participants of the study.
Results
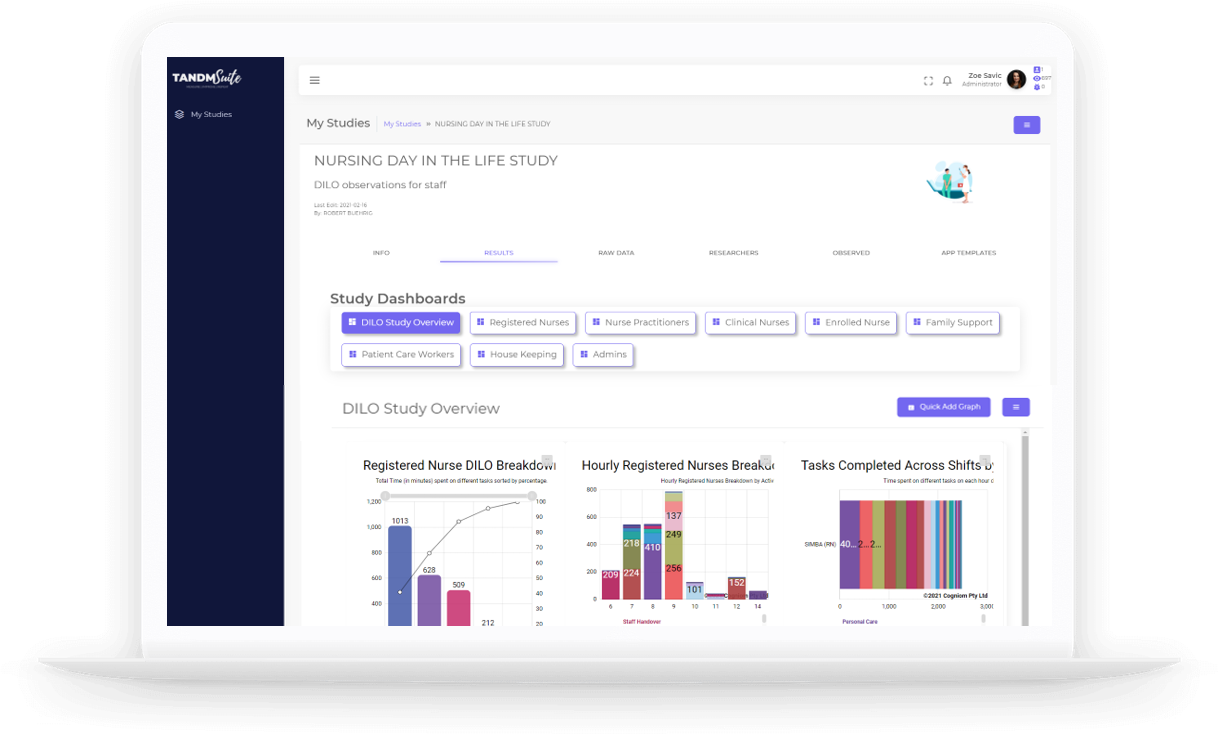
The home of all data visualisations.
You can navigate between dashboards by using the list of Study Dashboard titles. Adding and editing dashboards can also be completed in this page.
Building and editing graphs are completed via the appropriate menu items and prompts. The colour scheme, graph size and order and also be amended here.
Dashboard filters are also available to drill deeper into your data which is fed liv into this page and available with a simple page refresh.
– See Visualising Your Data to learn more about creating graphs and dashboards.
– See Editing in TANDM to learn more about editing graphs and dashboards
Raw Data
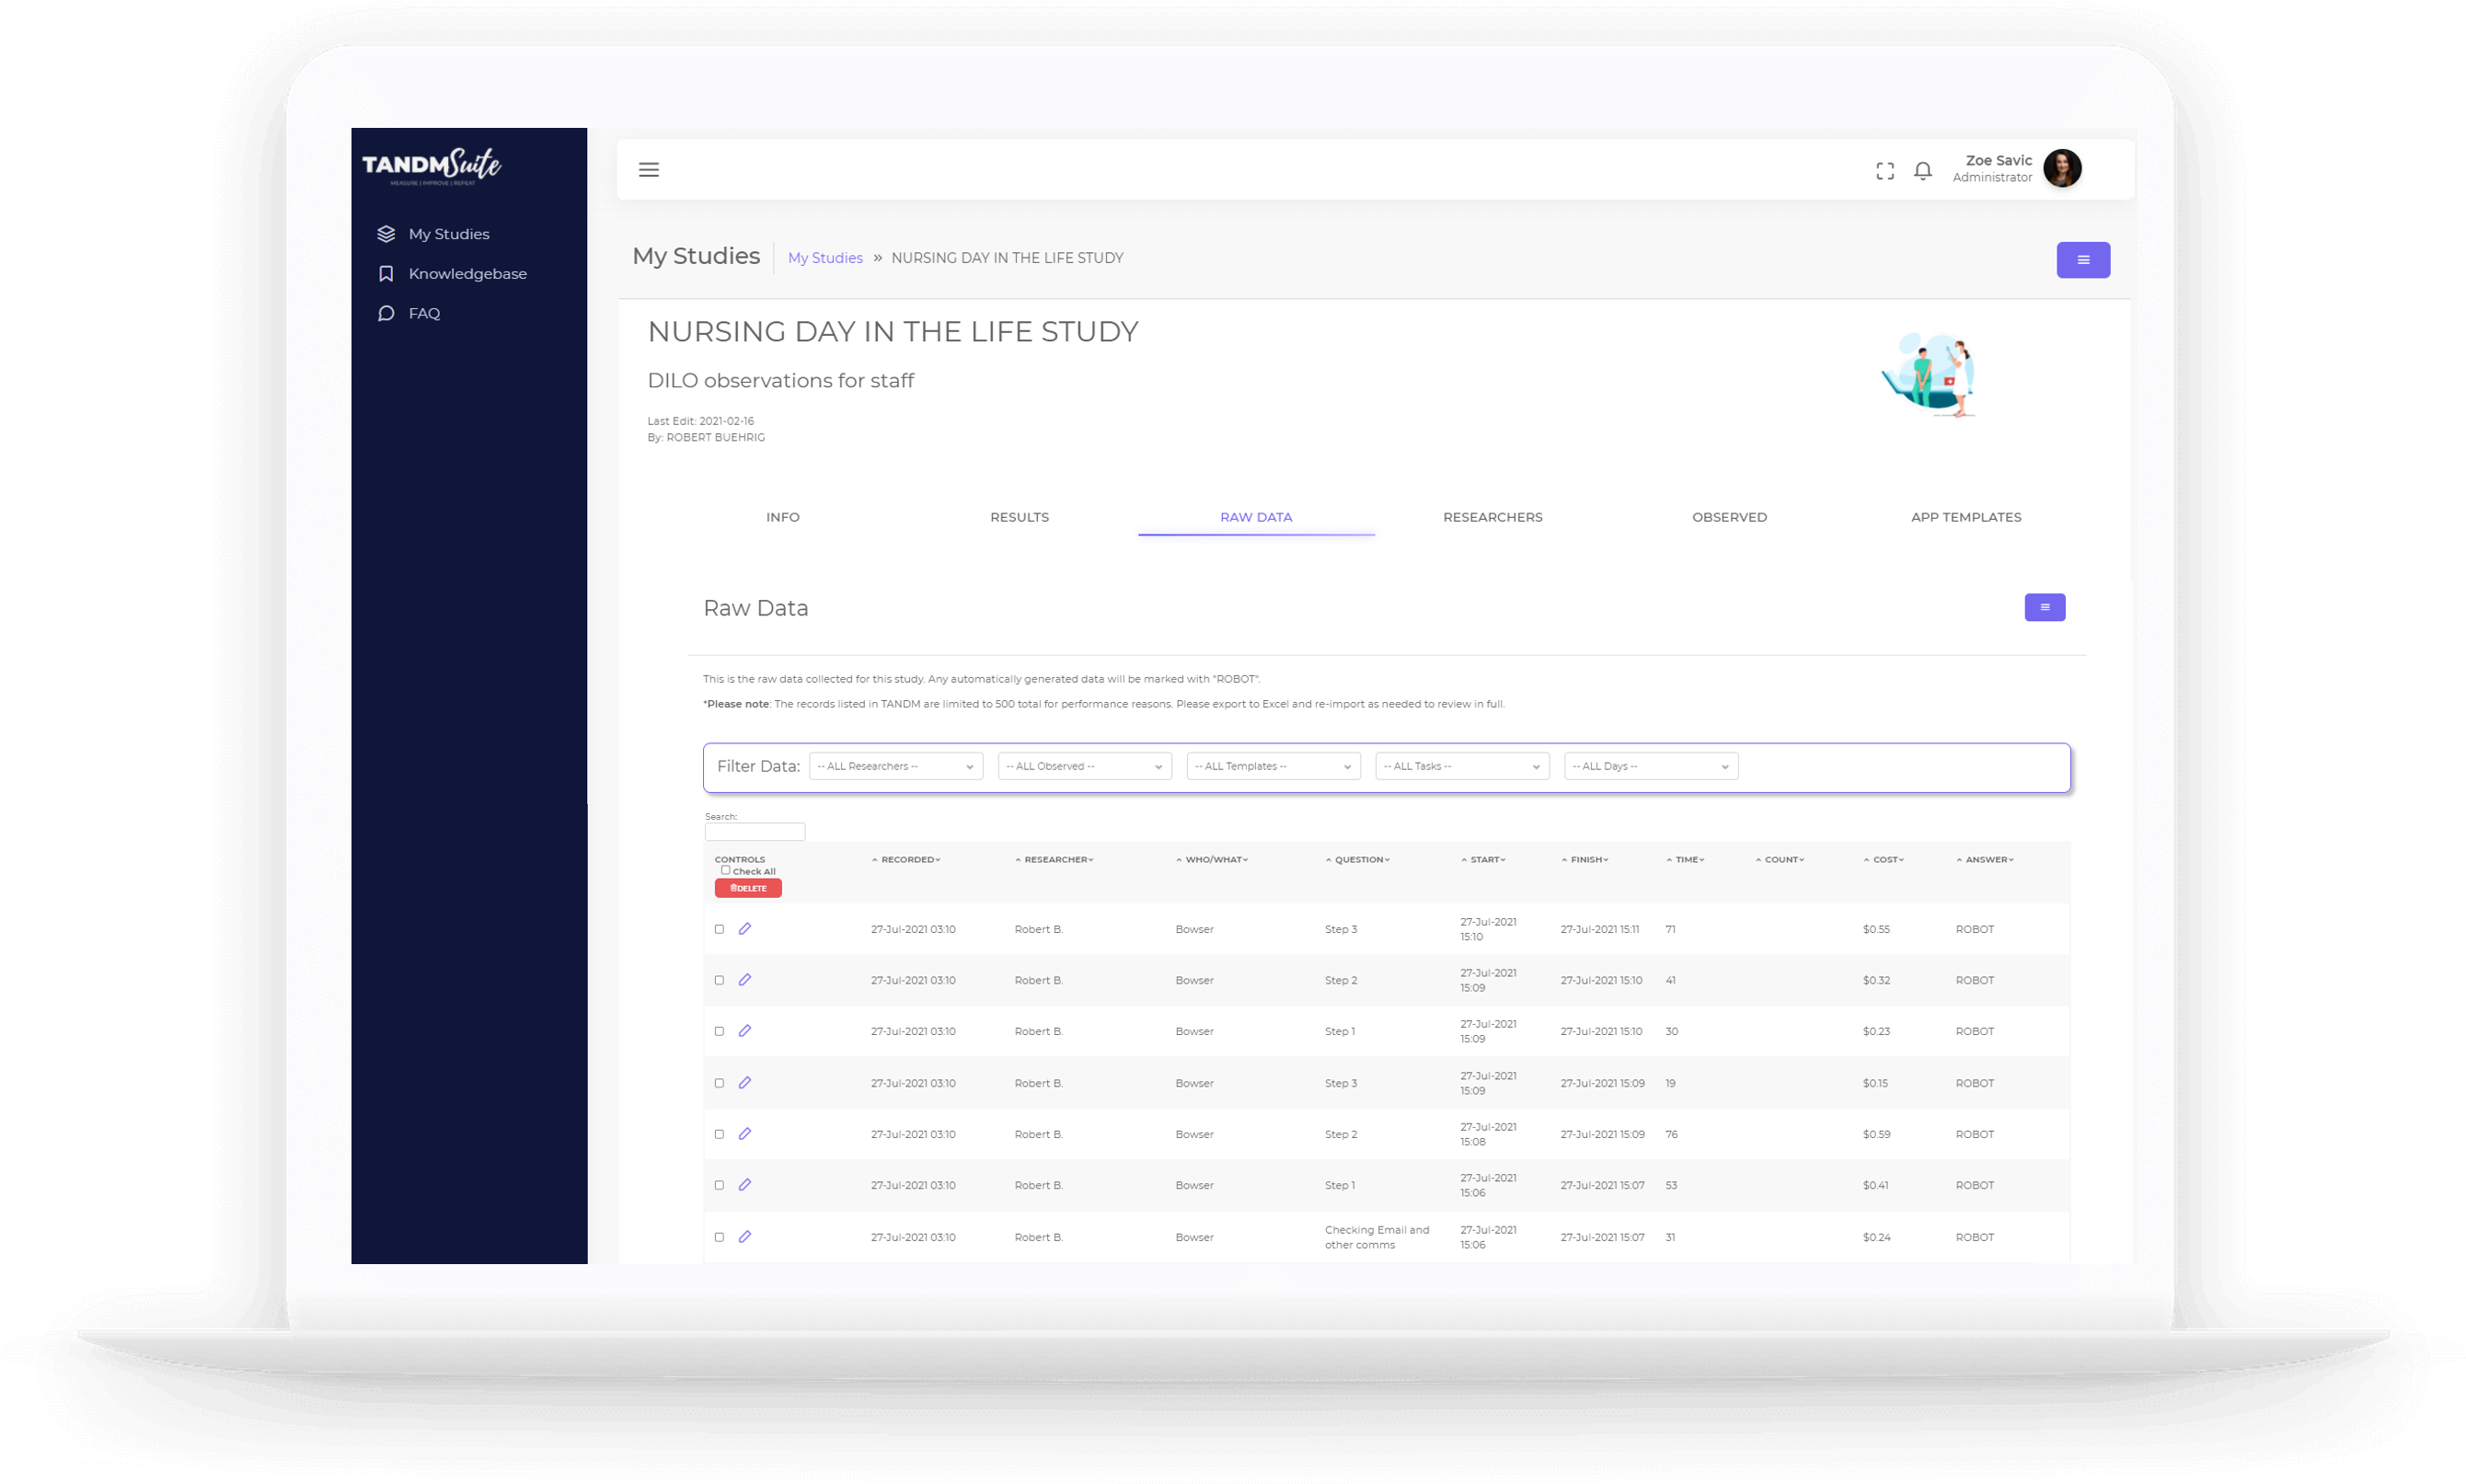
This page stores all data collected across all App Templates that may be associated to your Study in its raw form. Hence the name.
It’s also the home of the infamous “ROBO DATA” which allows you the opportunity to understand what your visualisations will look like BEFORE you start collecting real data.
There is an easy to use filter to help you look for particular lines of data.
– See Visualising Your Data to learn more about Generating Robot Data
– See Editing in TANDM to learn more about editing Raw Data
Researchers
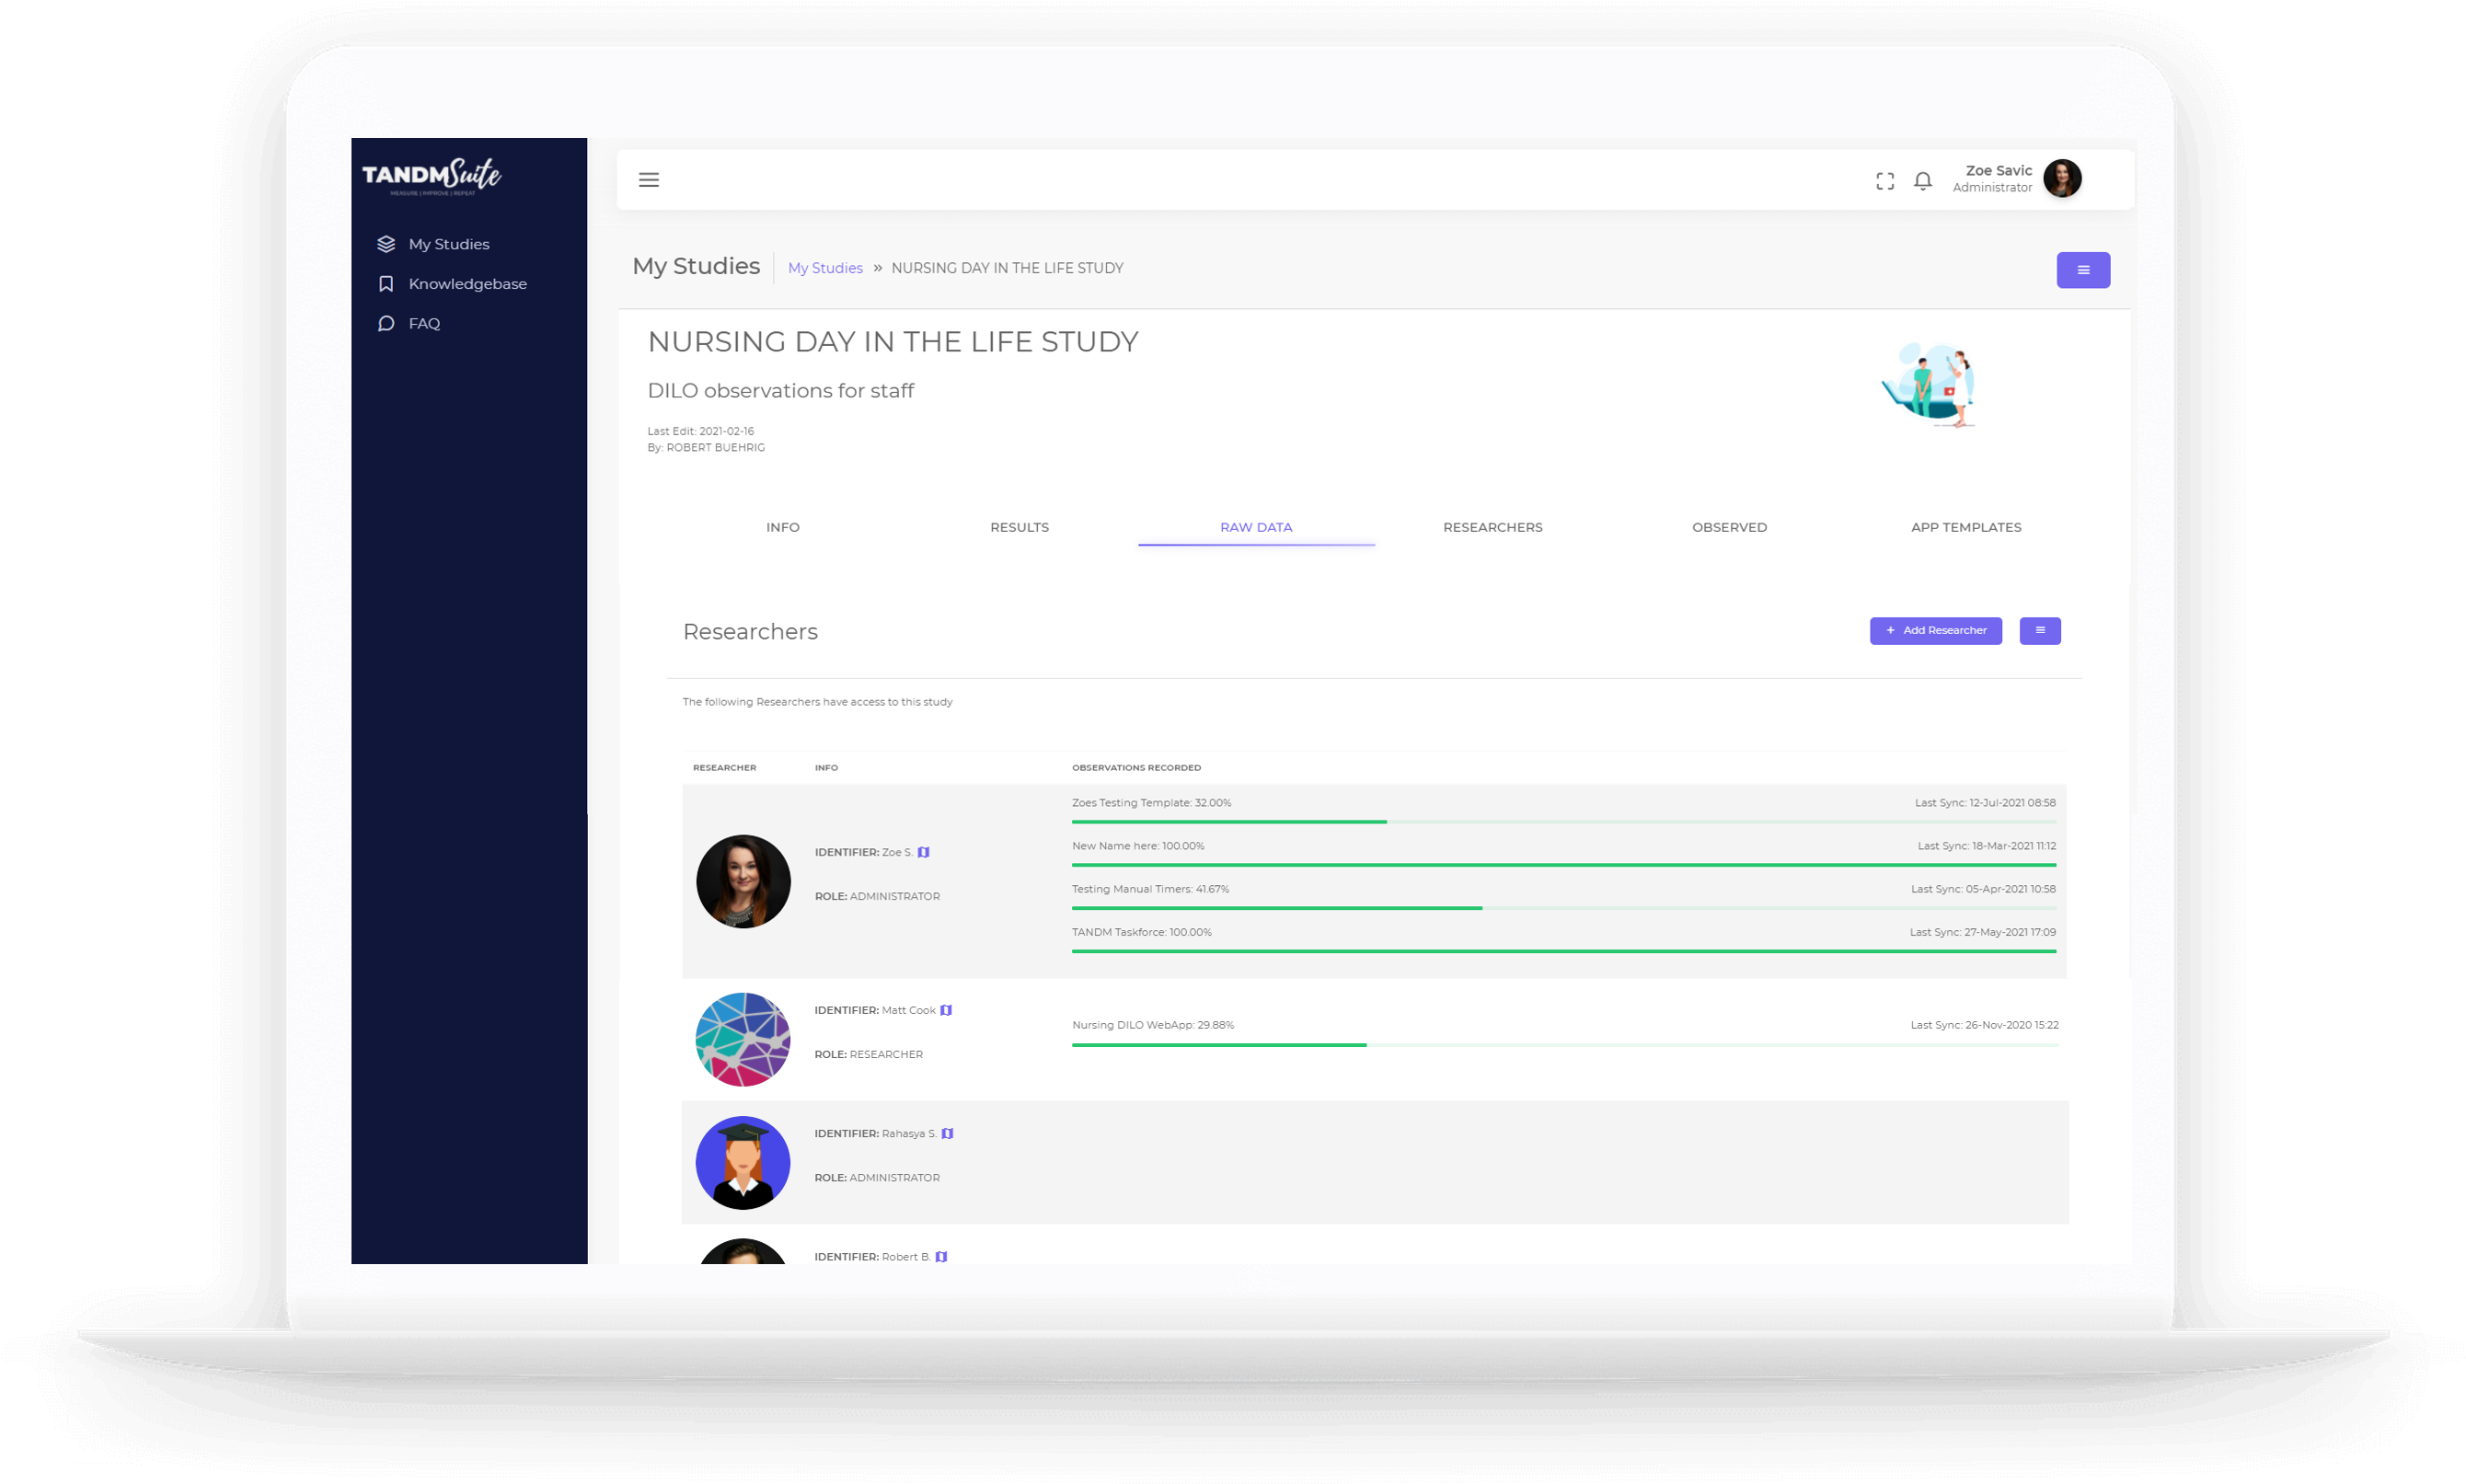
You may refer to them as Users, but whatever you call them these are the people that require a login to use the TANDM Suite. Generally they will be Study Administrators or Coordinators who will play a significant role in your Study.
Simply click on the purple “Add Researcher” button and follow the prompts or click on their profile image to edit existing Researchers.
From here you will also be able to edit profiles, reset passwords and update access permissions. You’ll also see a high level overview of their activity.
– See Editing in TANDM to learn more about editing User Profiles
Observed
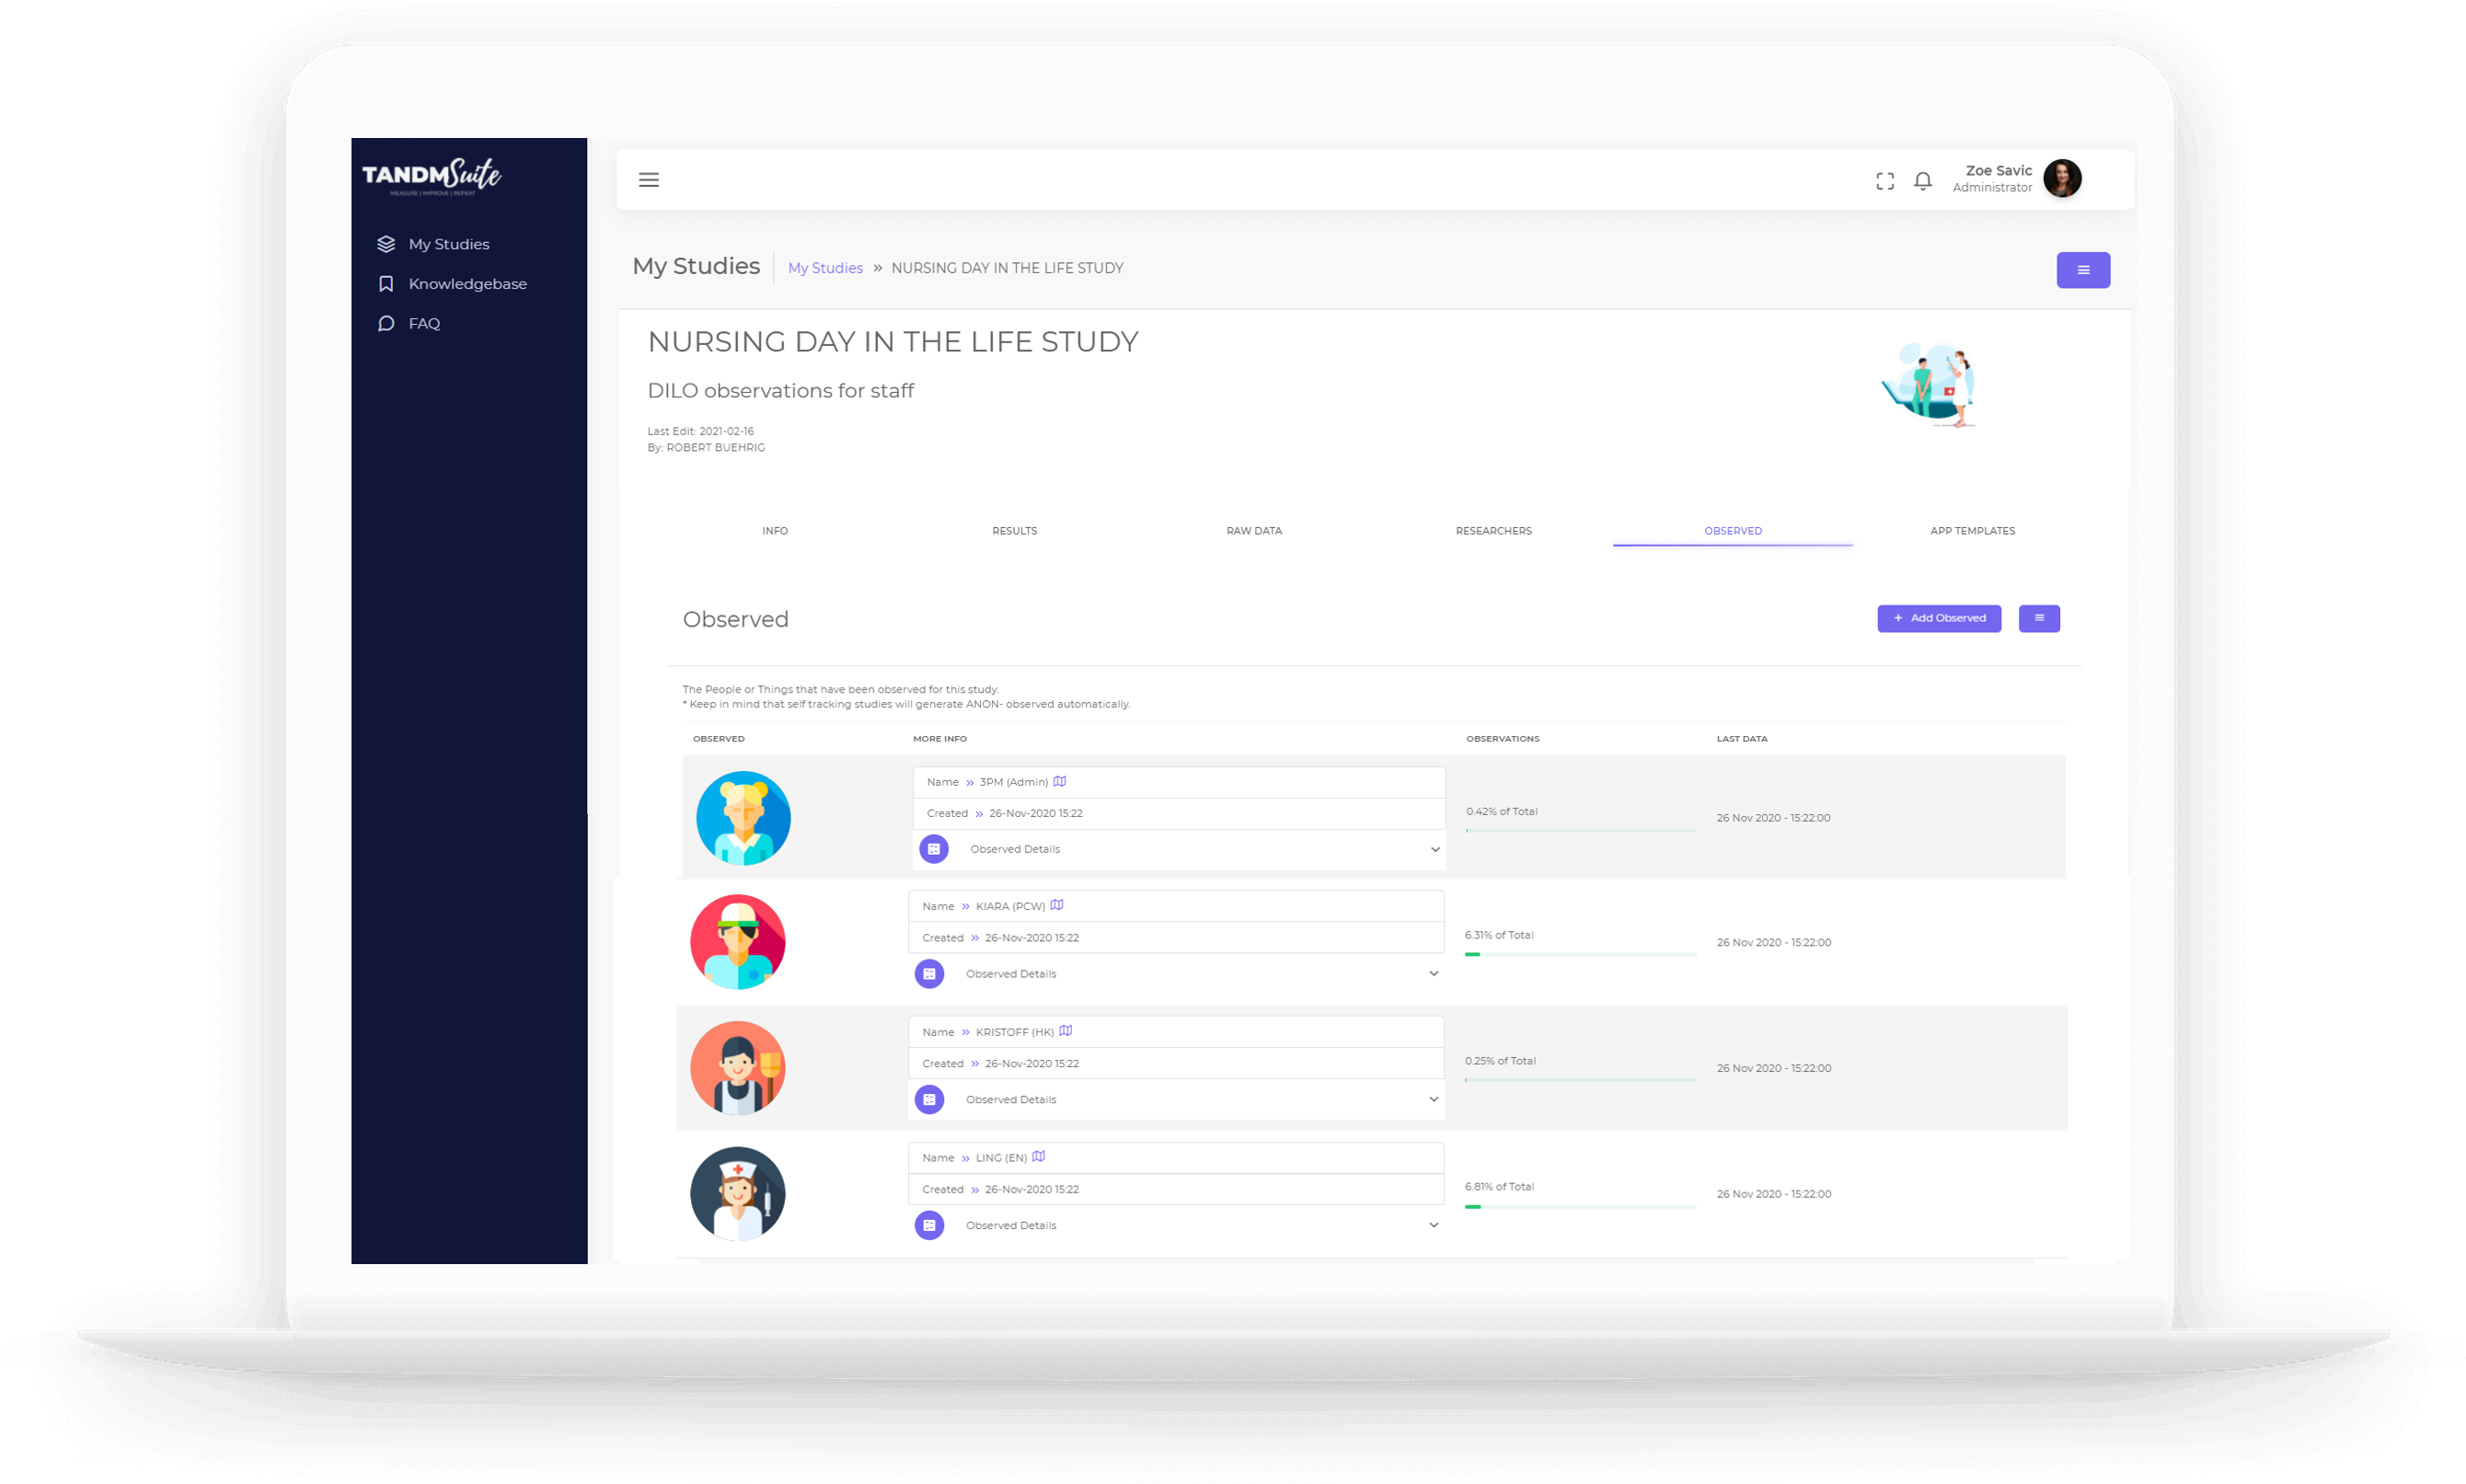
Observed are the participants of the study that the data is about. This can be people that have taken a survey, were interviewed, performed a self-reporting study on themselves, or were shadowed during a Q&A. Observed can also be objects like a location or piece of equipment that is being studied.
You will find the Observed Details in play for each of the Observed. This may include things like social demographics, wage rates or location and are used as additional filter options for your graphs.
If you have a predetermined list of Observed parites, click on the purple “Add Observed” button and follow the prompts.
If you have Robot Data generated, it will also be listed here.
– See Creating Studies to learn more about Observed Details
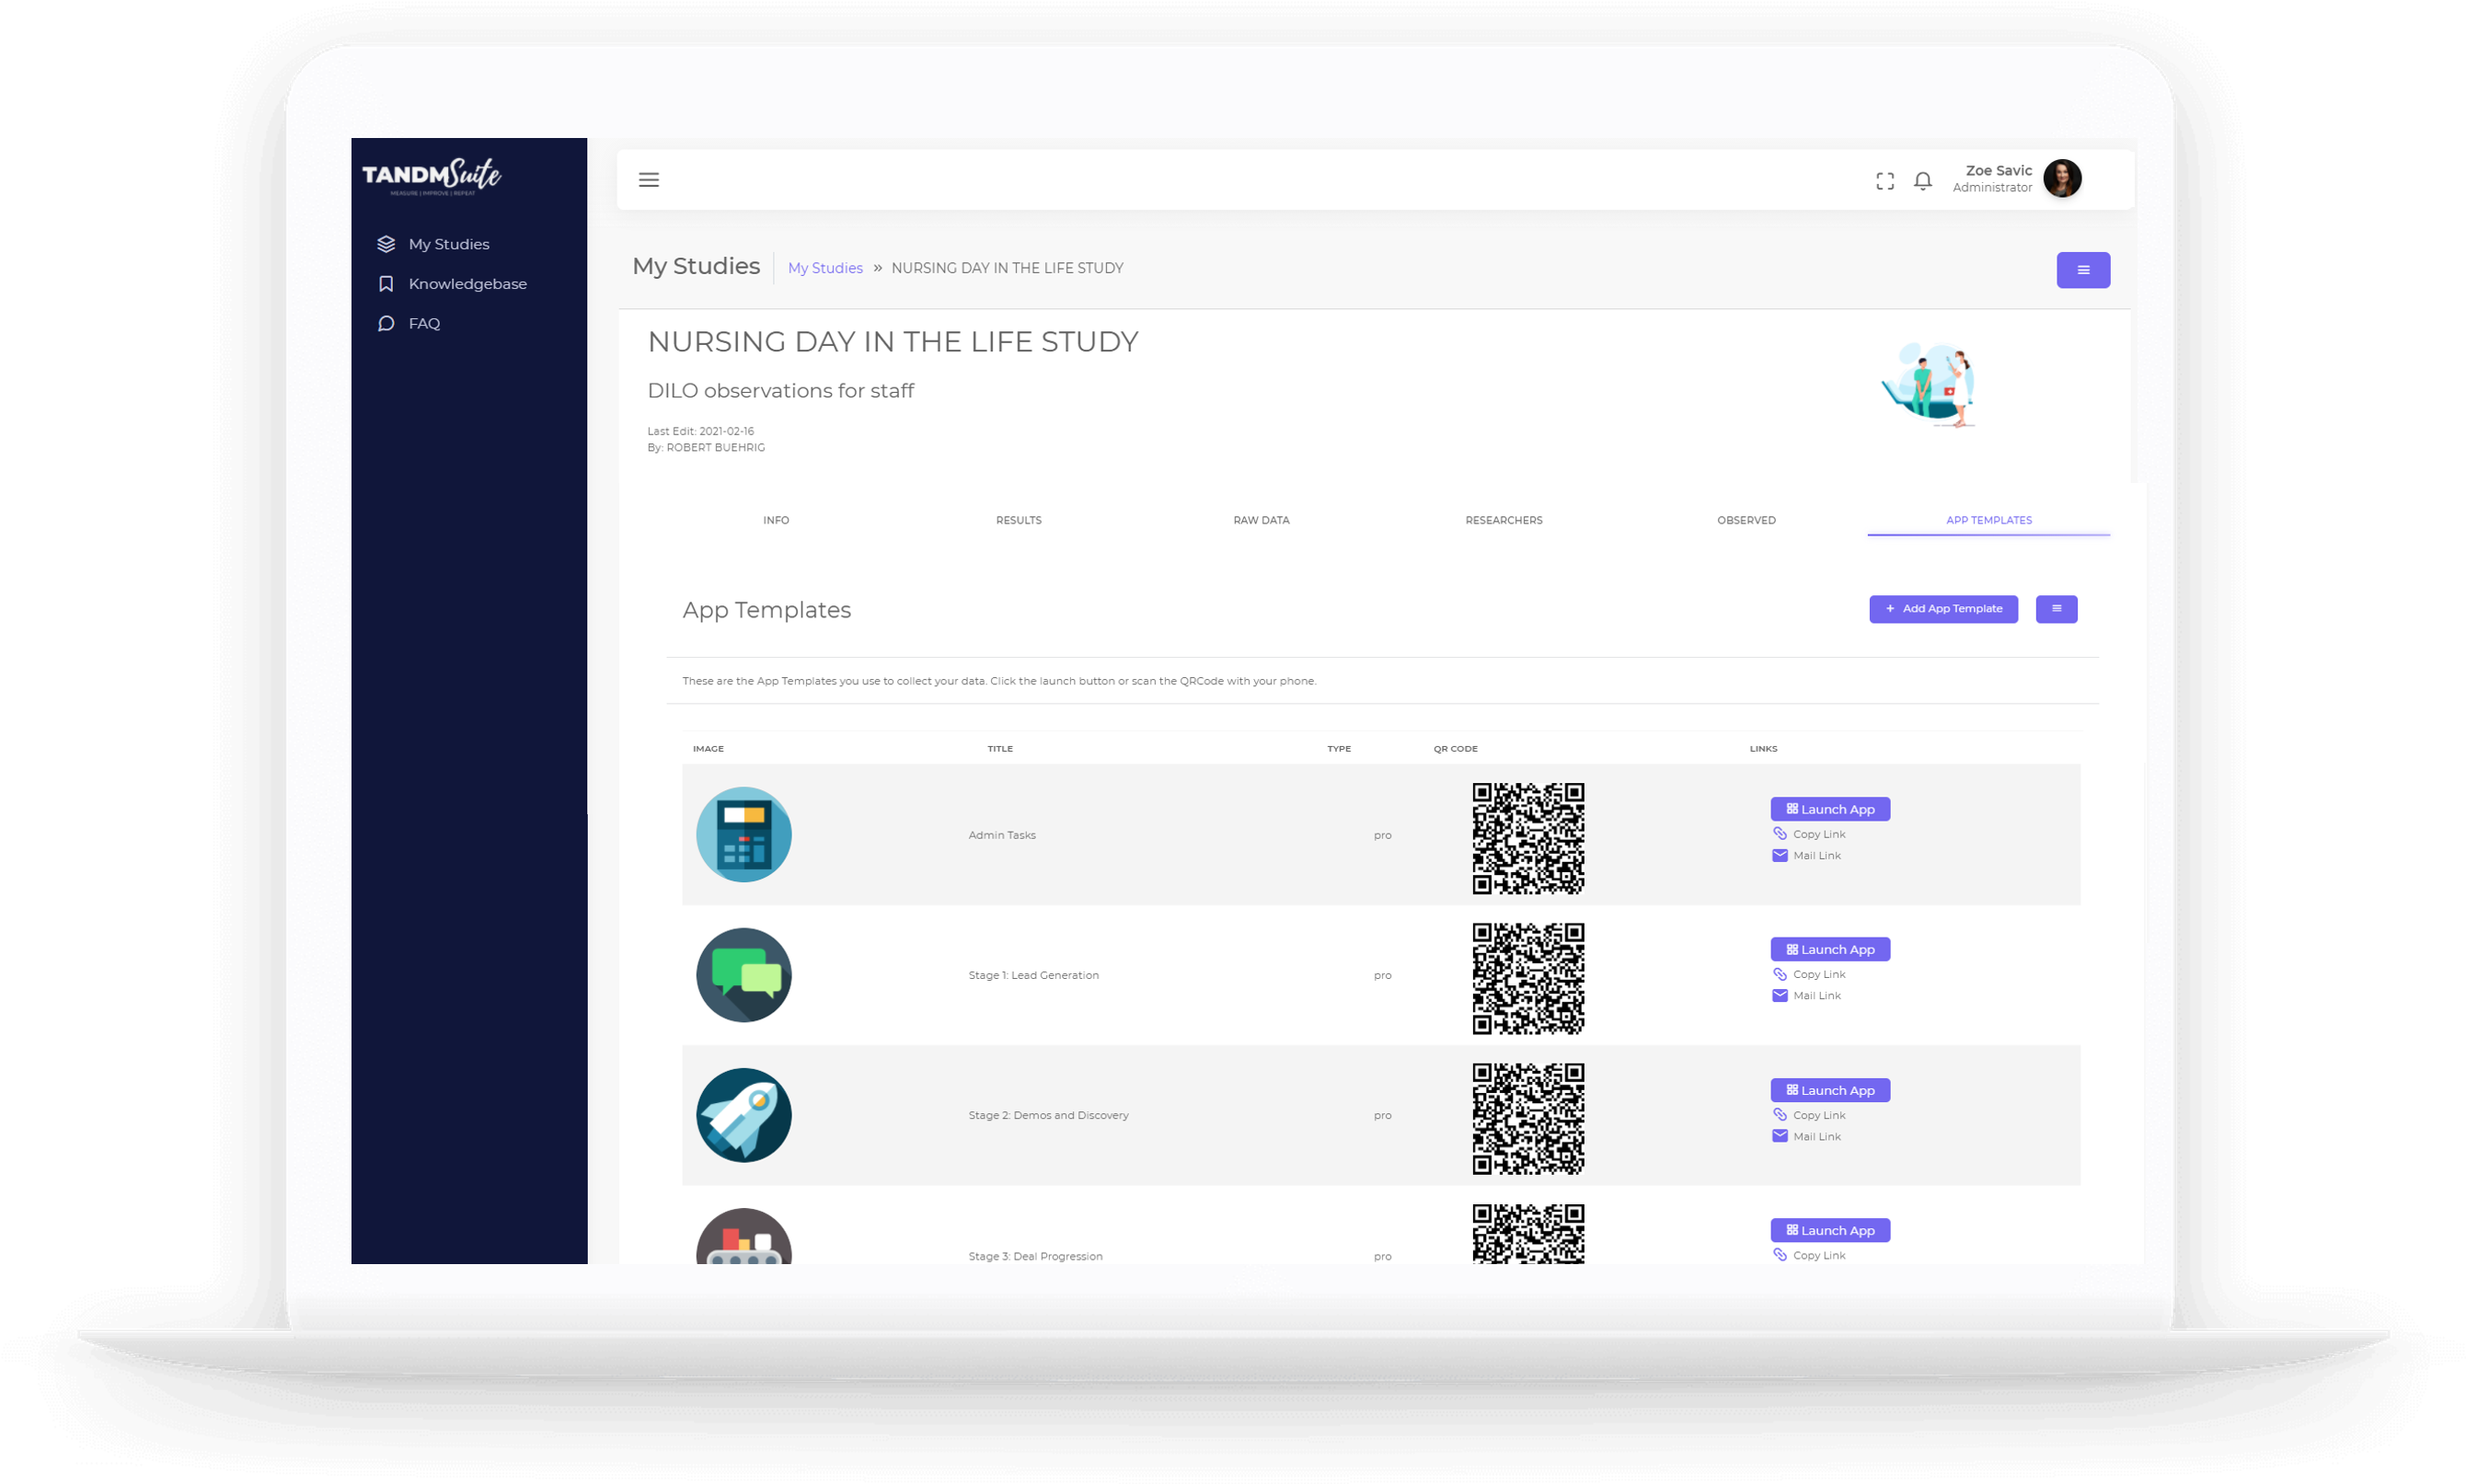
App Templates
App Templates is how you collect your data! They are collections of timers, counters and survey questions that you can coose from to build an app suited to the needs of your project.
A Study can have multiple App Templates each with their own data collections. For example a study of a factory could have a Watch & Learn template for the assembly line times, a satisfaction Survey from the front-line workers, and an Interview template for the painters. All data from the App Templates are pooled together in the same study to help troubleshoot problems the factory is having.
– See Creating Studies to learn more about building App Templates
