See whats new inside the TANDM Suite
with this month’s software updates.
TYPE: New
WHERE IS IT: TANDM Study Page > App Templates Tab
FEATURE: QR Codes
SUMMARY: QR Codes allow you to print out or link people to research Templates using their phones/smart devices.
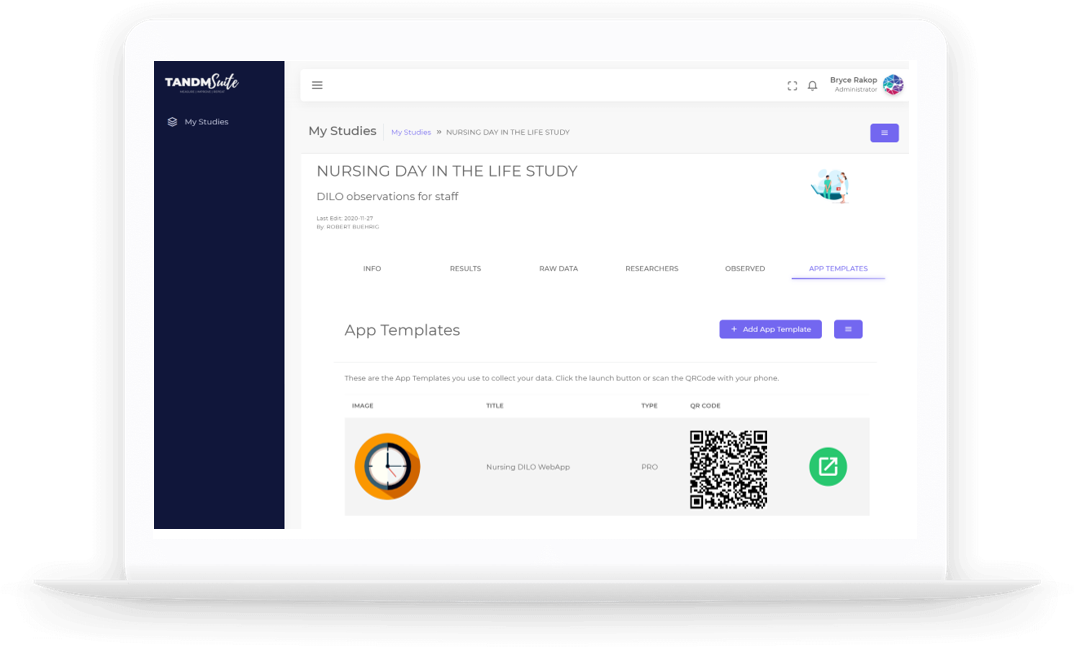
WHY IT MATTERS: Self-Reporting is a lot easier when it’s not a long complicated link, but just a code your phone figures out. These can be invaluable when trying to engage with audiences with little or no research background.
*PRO Tip: Right click and copy the image instead of using snipping tools, you’ll get a much clearer bar code!
TYPE: New
WHERE IS IT: TANDM Study Page > Login Access
FEATURE: Duo Multi-Factor Authentication (MFA)
SUMMARY: Additional security is never a bad thing, and by integrating Duo into our applications it adds secondary authentication for users via their phone or e-mail.
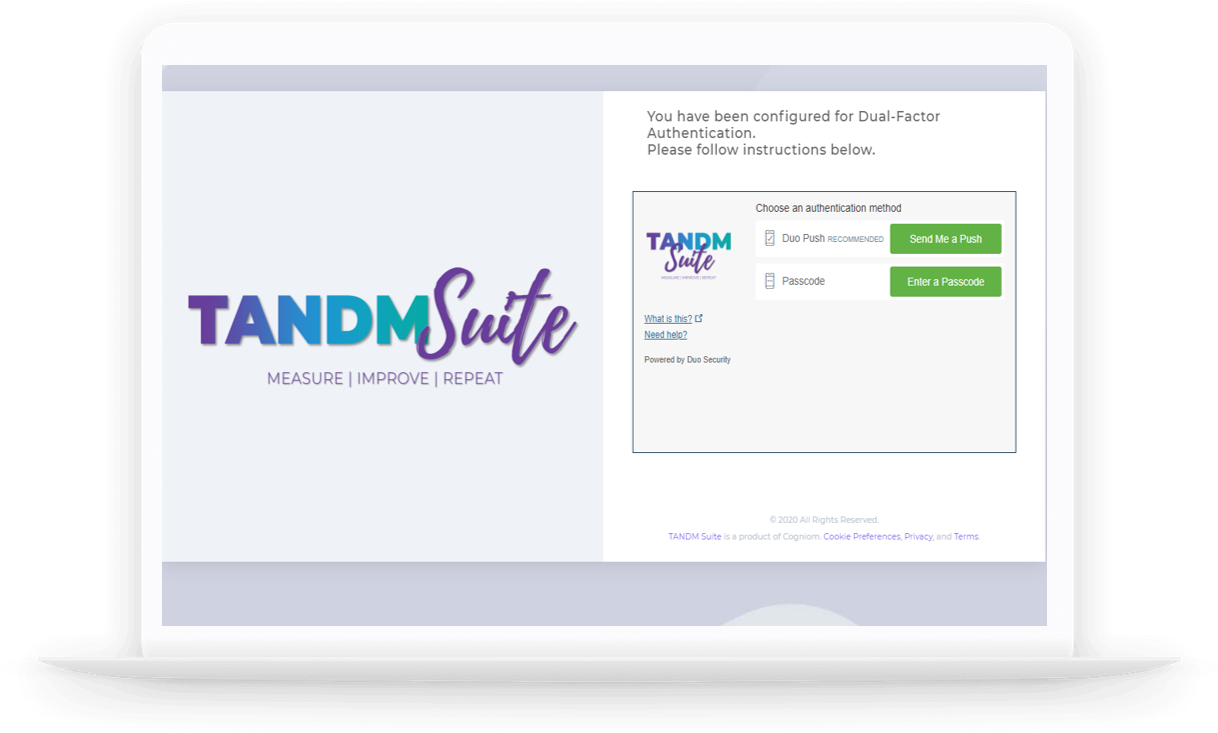
WHY IT MATTERS: Your data integrity and security is our top priority here at Cogniom, and things like this really enhance the overall security of your data.
TYPE: Enhancement
WHERE IS IT: TANDM Study Page > Results Tab
*TO ACCESS IT: Use the Hamburger Menu on the Dashboard -> Show/Hide Dashboard Filters
FEATURE: Dashboard Dynamic Filtering
SUMMARY: Apply data filters to all the Graphs in your Dashboard at once, -OR- if you choose to “Override” you can change the ALL the Graph filters at once to use the filter you’ve selected.
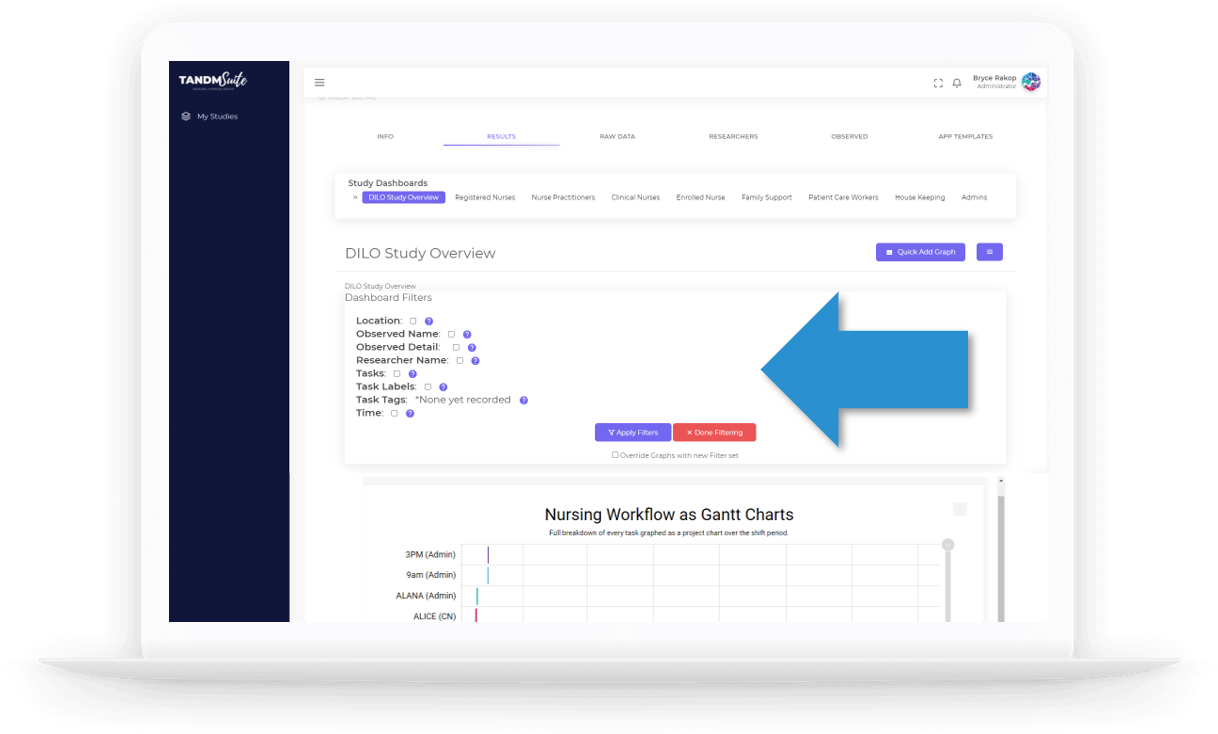
WHY IT MATTERS: Sometimes you want to drill down into a Dashboard for a specific Observed or Observed Detail to understand how that person stands out from the rest. Sometimes though, you want to setup a Dashboard per Job Title (or other Observed Detail) so that when you look at that Dashboard it’s already filtered that way. This feature makes these kinds of changes quick and easy.
TYPE: New
WHERE IS IT: TANDM Study Page > Results Tab -> Edit Dashboard -> Colour Set Tab
FEATURE: Dashboard Colour Palettes & Presets
SUMMARY: All Colour controls have been moved from Templates to Dashboards.
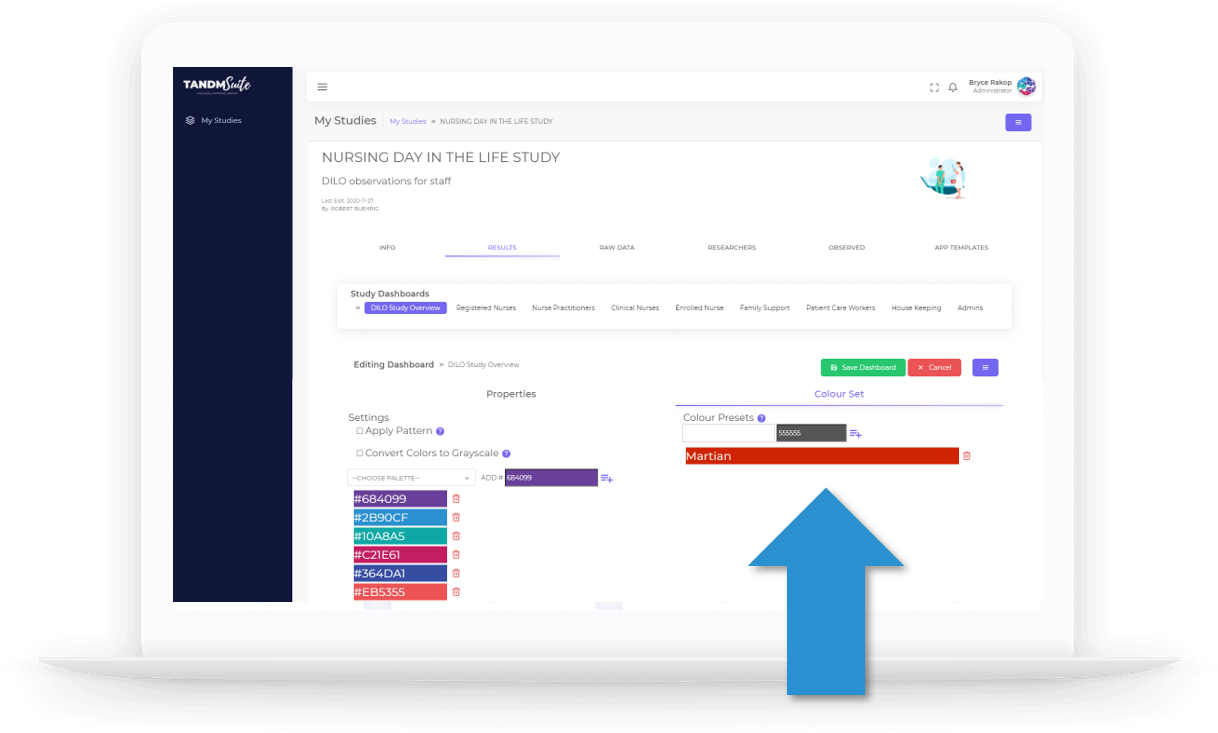
WHY IT MATTERS: It makes much more sense to be controlling the Colours across each Dashboard. This also brings with it several key improvements to how we handle Graph Colours in general:
- We have fixed Graph Categories so they use the same Colour to represent the same things. (e.g. If “Bryce on YouTube” were a Category on many different graphs, they would all be the same colour.)
- We allow for Presets to default any specific Category to a certain colour so you choose what colours mean specific things.
- We still offer collections of Colour Palettes which allow you to make the Dashboard look and feel like your own Colours.
TYPE: New
WHERE IS IT: TANDM Admin Page > Results Tab -> Edit Dashboard -> Colour Set Tab
FEATURE: Patterns & Grayscale for Dashboards
SUMMARY: Checkbox options are now available to enable patterned and/or grayscale for all Graphs on a Dashboard.
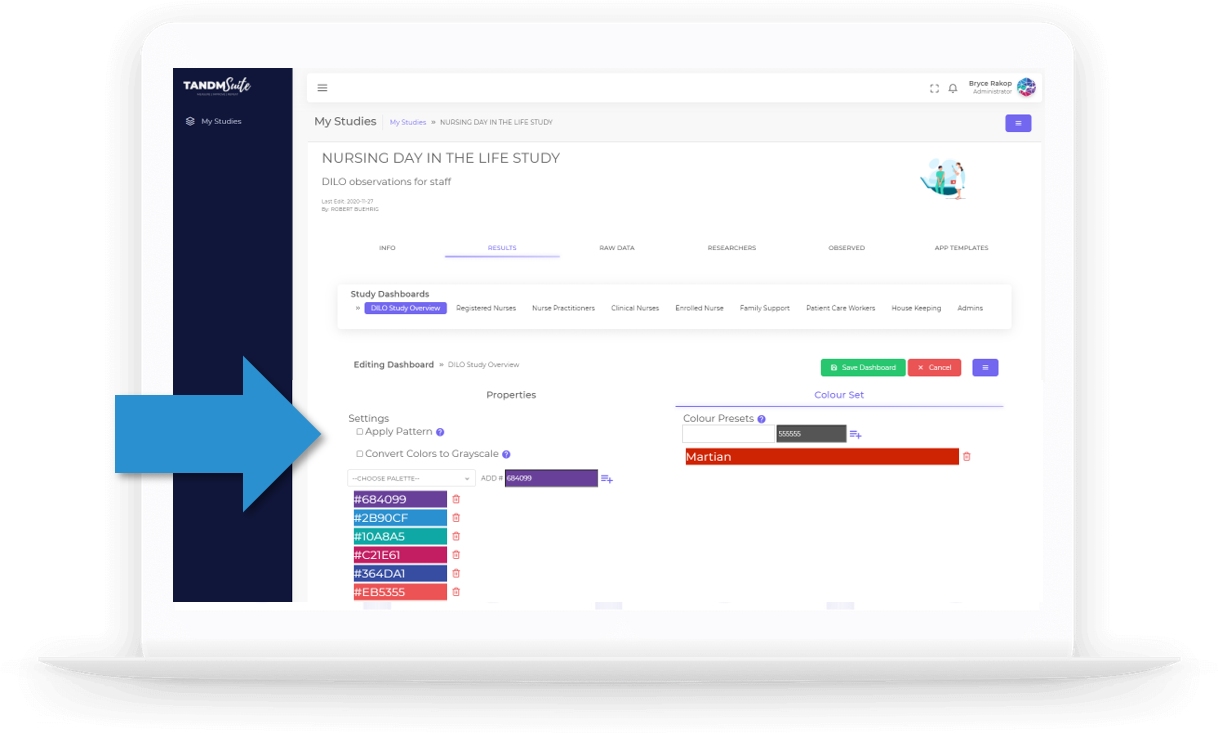
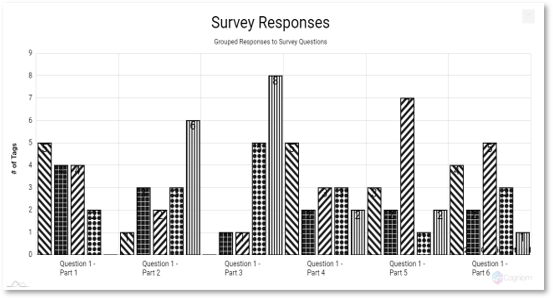
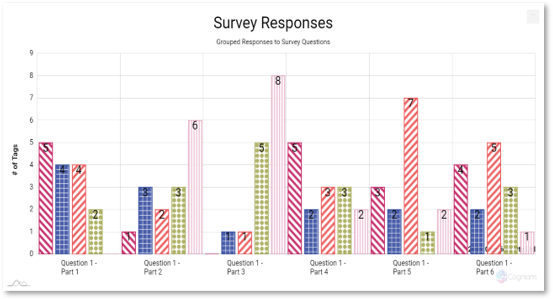
WHY IT MATTERS: Sometimes you have to have patterns to see results clearly. Sometimes you need a Graph in grayscale to get it published. Now you can do either, both, or neither!
TYPE: New
WHERE IS IT: TANDM Study Page > Results Tab -> Edit Dashboard -> Properties Tab
*TO ACCESS IT: Click the “Re-Order Dashboards & Graphs” button to the right of Graph Layout
FEATURE: Drag & Drop and Delete Graphs and Dashboards
SUMMARY: Using this feature you can now arranging Dashboards and the Graphs on them, in any order just by dragging them where you want them to be.
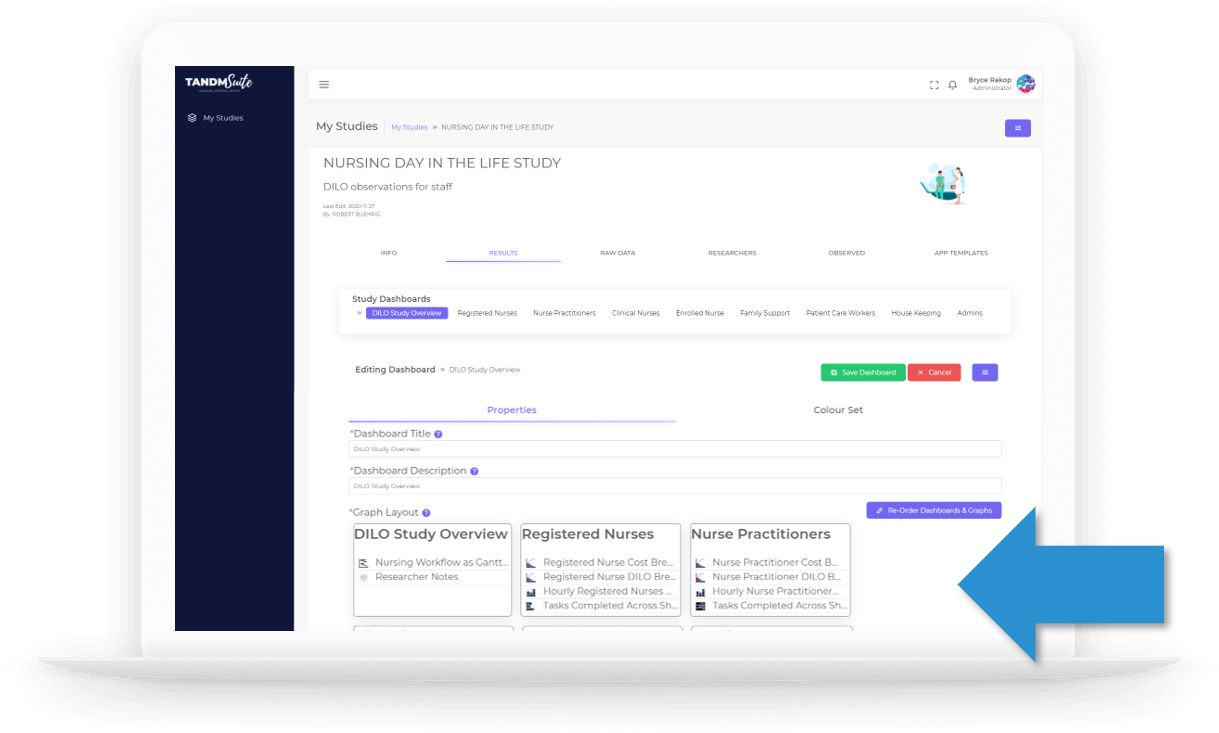
WHY IT MATTERS: Arranging Graphs used to be a one at a time hassle, with Dashboard Order being its own separate control. Now you can Drag & Drop Graphs to anywhere, re-order the Dashboards themselves, and even throw away Graphs you don’t need all in one easy to manage form.
TYPE: New
WHERE IS IT: TANDM App (PRO) > Menu on top left after logging in
FEATURE: Change Password from App
SUMMARY: Researchers can now change their password straight from the TANDM Pro App
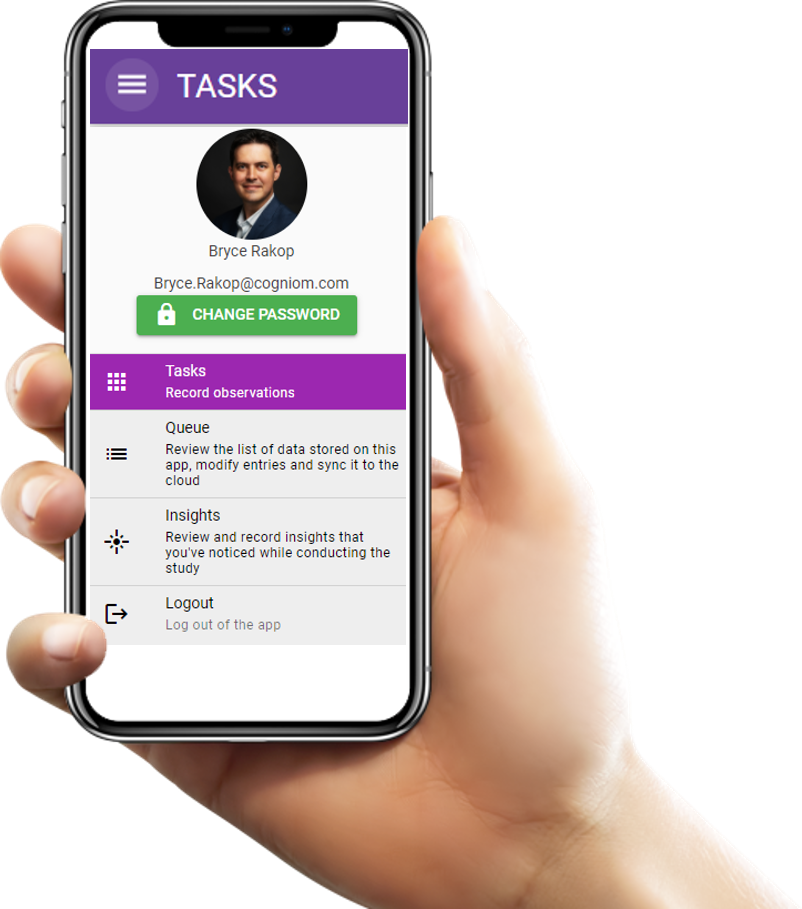
WHY IT MATTERS: When onboarding many researchers at once, you want to use a generic initial password. Now it’s super easy for your users to change it to something they can remember as soon as they login the first time. This eliminates the need for many to ever even go to the Admin page, so they can focus on just gathering data.
TYPE: New
WHERE IS IT: TANDM Study Page > App Templates Tab -> Edit Template
FEATURE: Dropdown Display type for Survey Questions
SUMMARY: You can now use Dropdowns for Survey responses in your App Templates.
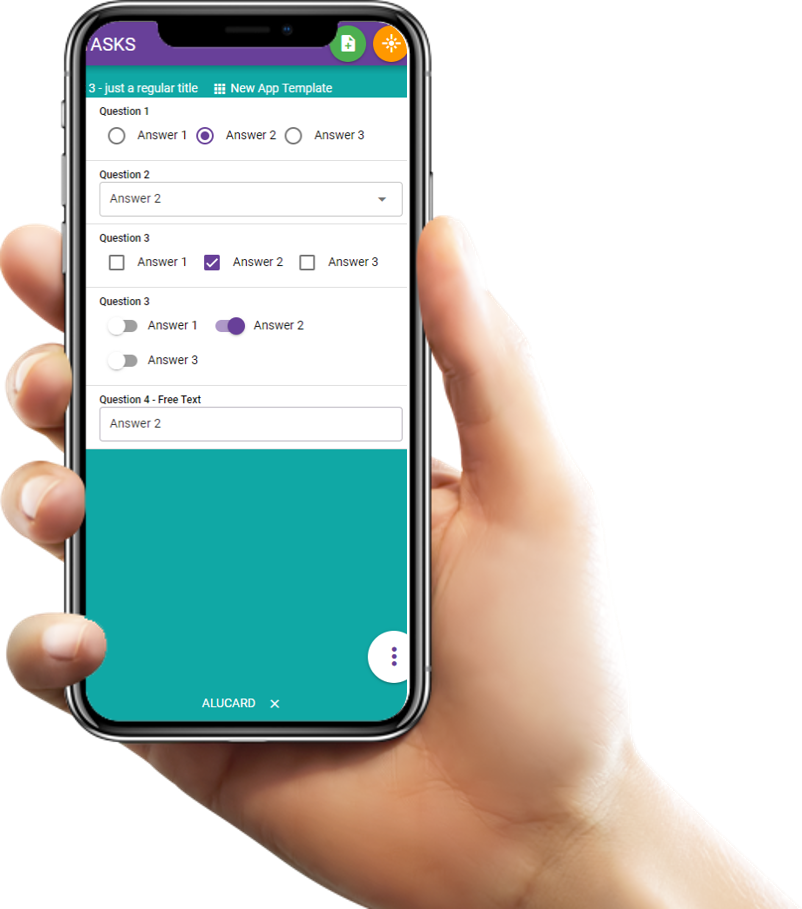
WHY IT MATTERS: Dropdowns are sometimes just the right choice for keeping your Surveys concise, so we put them in for you!
TYPE: New
WHERE IS IT: TANDM Study Page > App Templates Tab -> Edit Template
FEATURE: Answer Sets (Likert Scales)
SUMMARY: To help with your most common Survey questions, we have added several different templates for Agreement or Satisfaction. These are also known as Likert Scales.
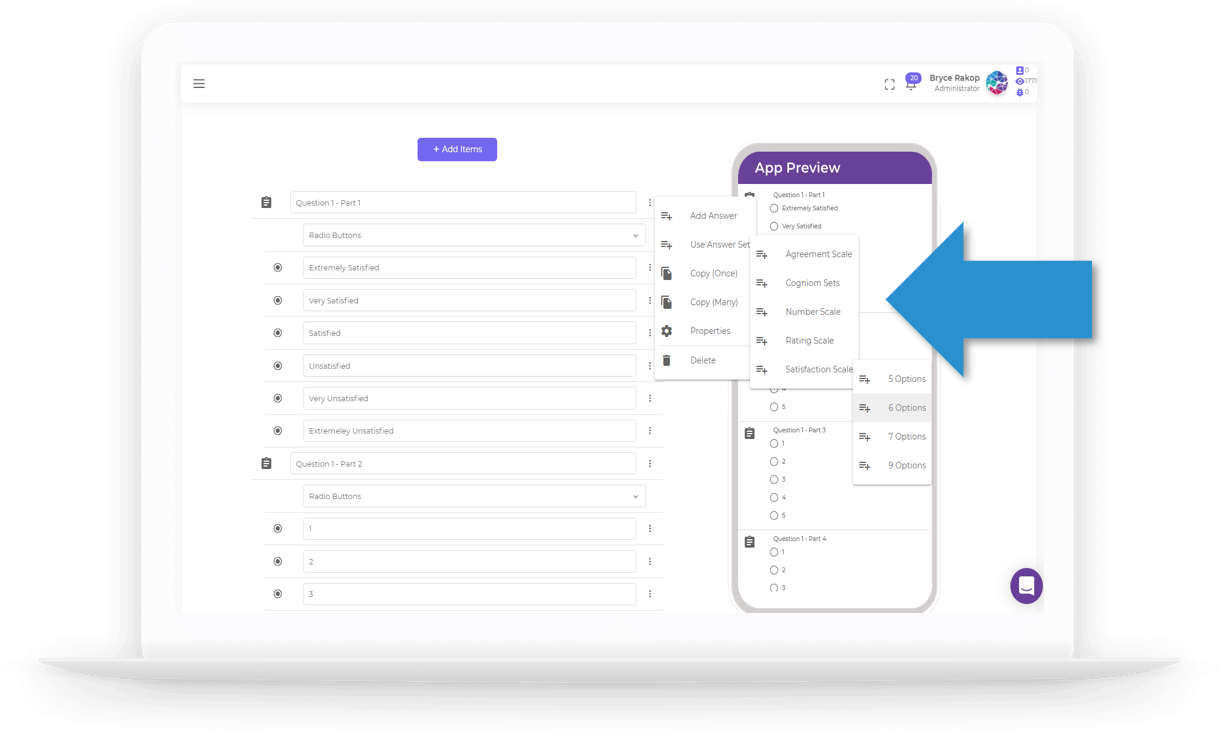
WHY IT MATTERS: This saves you a ton of time setting up your Survey Answers, and importantly, will automatically set the Values to match to help you calculate your scores in your Graphs.
TYPE: New
WHERE IS IT: TANDM Study Page > App Templates Tab -> Edit Template
FEATURE: Copy (MANY) for Survey Questions
SUMMARY: Use Copy Many when you have a lot of Survey questions that use the same Answer Sets.
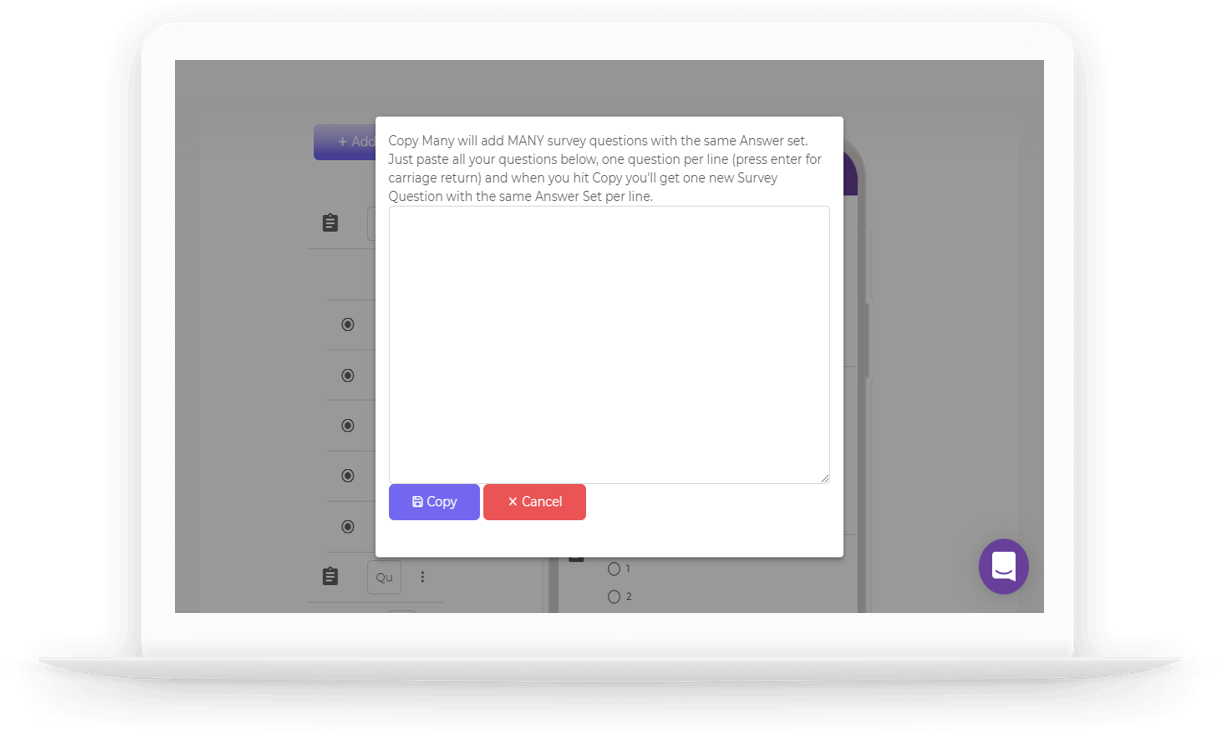
WHY IT MATTERS: Once you do the first question in your Survey, you can use Copy Many to setup all the other questions by copying and pasting all the rest of your questions into the text field. As long as each question is on a new line they will all be added in one click to your Template!
TYPE: New
WHERE IS IT: TANDM Study Page > Raw Data Tab
*TO ACCESS IT: Use the hamburger menu from Raw Data Tab to access the “Generate” and “Delete” Robot Data controls
FEATURE: Robo-Data
SUMMARY: Use Robo-Data to generate Robots that use your Templates to simulate user Data.
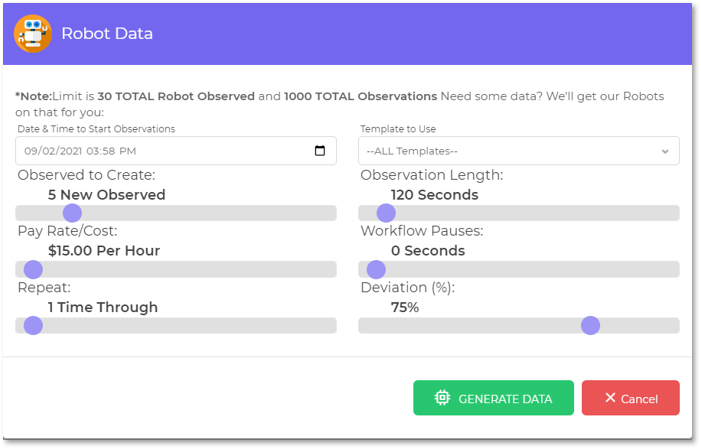
WHY IT MATTERS: We want you to know from the start that your data set is what you need. To achieve this we use Robots to simulate the data your Templates can create. This was a pre-requisite step to the next feature, Robo-Graphs!
TYPE: New
WHERE IS IT: TANDM Study Page > On Study Creation
FEATURE: Robo-Graphs
SUMMARY: When creating a new Study our Robots build graphs to match the Template that you’ve built so you can check that what you’re collecting aligns with your goals of the Study.
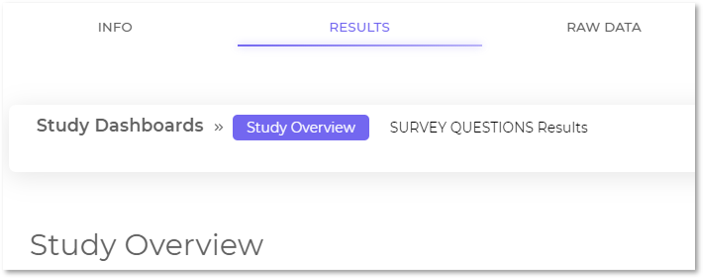
WHY IT MATTERS: We all want just Magic things in our lives, and when you’ve just built a Study and you can instantly see what kind of Data and Graphs will come from it, well it isn’t “Magic” but it’s pretty magical!
TYPE: Enhancement
WHERE IS IT: TANDM Study Page > Profile Menu -> Dark Mode
FEATURE: Dark Mode v2
SUMMARY: Dark mode has been enhanced and improved to ensure all components toggle when you switch in and out of Dark mode.
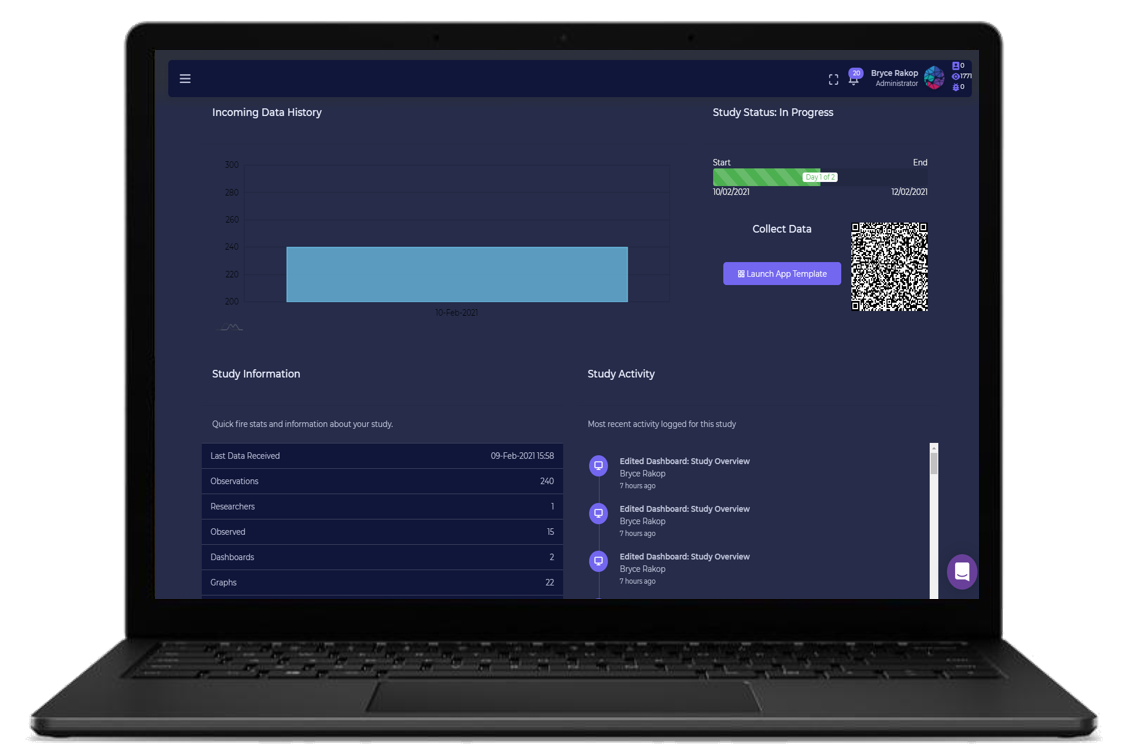
WHY IT MATTERS: If you like Dark mode, it’s gotten an upgrade, and now it is far more consistent with how it handles each page and ensures things like Graphs, Dashboards, and Summary graphs re-render to match your preference.

