About

Your business and projects are inherently filled with information and insights that are crucial to making the best decisions for the future, ensuring the opportunity for positive outcomes.
So why is it so hard to extract that information?
The TANDM Suite has made capturing information and insights easy. Providing real time results in a platform that is customisable to suit any situation, users of our software can enjoy every opportunity to make data driven decisions and drive the success of their business and projects even higher.
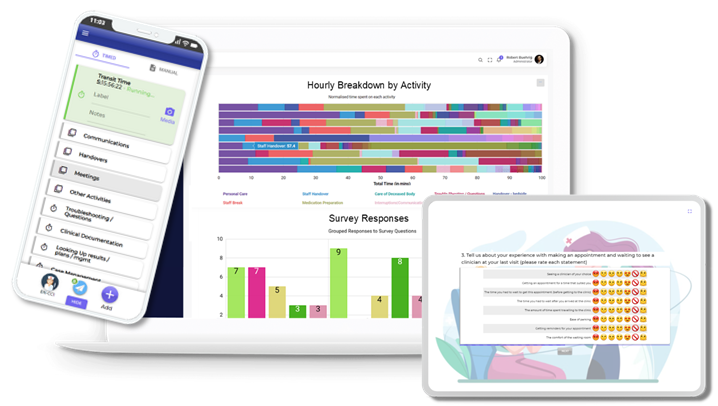
We use the saying “Your data, Your way” and we strive to achieve that in every scenario imaginable
Whether clients are looking to capture timings, understand experiences or utilise data from existing sources, creating a data capture tool that suits individual needs has never been easier.
Clients also enjoy peace of mind that information is being collected in a uniform way ensuring the integrity of their data.
Helping organisations discover truths, identify value and empower teams to achieve positive business outcomes is what we are constantly striving to do with the TANDM Suite as the ‘one stop shop’ for data-driven needs.
Time Collection.
Click here to learn more about Time Collections.
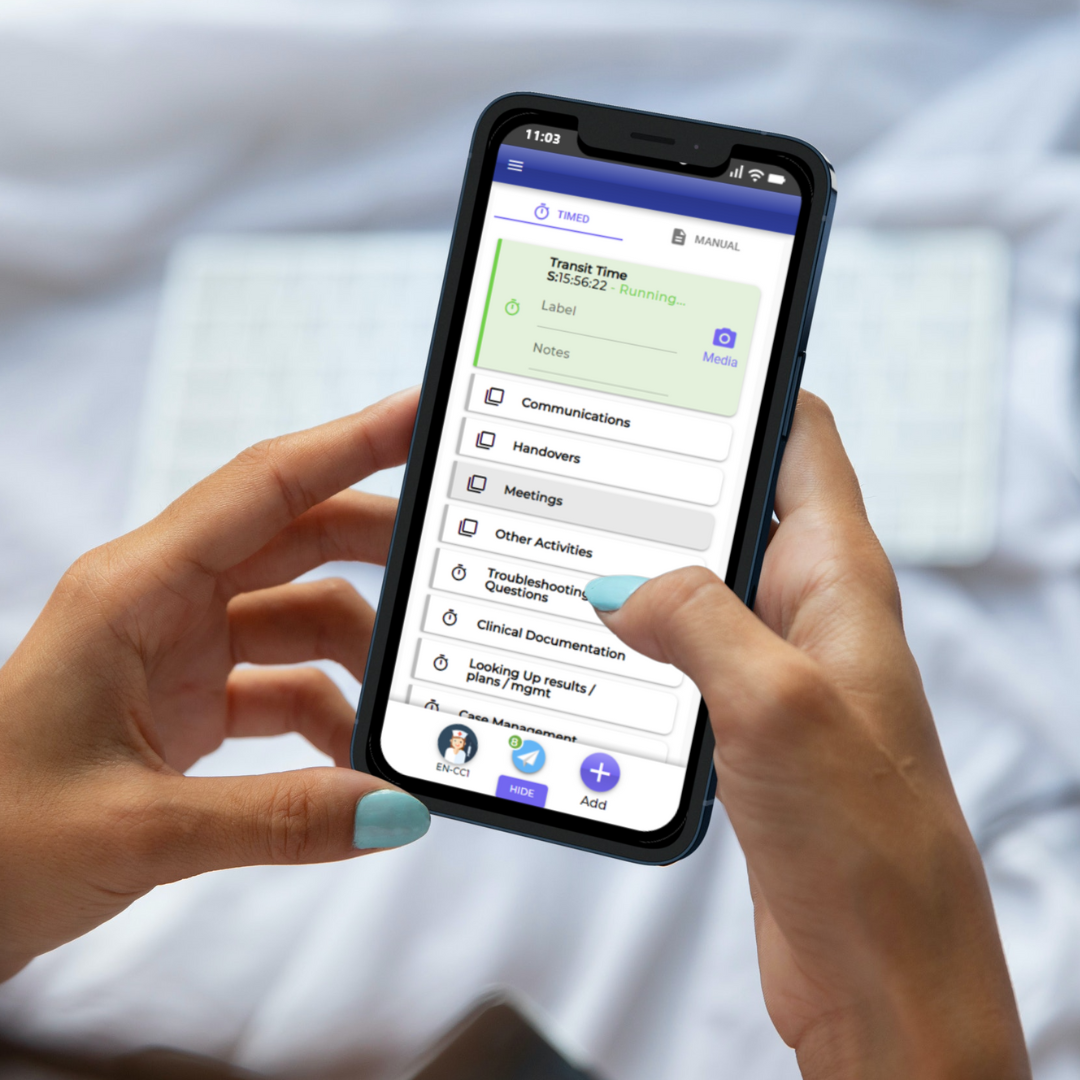
Time and Motion
Analyse the time spent in going through the different motions of a job, task or process.
Efficacy Study
Determine whether an intervention produces the expected result under ideal circumstances and measure the benefit.
Self Reporting
Gather information on your own time to produce a business case for change.
Observational Study
Observe a person or process to understand how workflows unfold and determine where potential areas for improvement may lay
Benefit Realisation
Measure ‘before and after’ markers to identify what benefit was received after implementing change.
Ethnographic Study
Observe people or groups of people in their own environment to gain qualitative results.
Day in the Life (DILO)
Observe someone through a typical day to not only understand their routine and tasks but also other elements that may impact their work.
Return on Investment
Evaluate the financial impact an investment into changed process or innovation.
Diary Study
Collect qualitative information by having participants record entries about their everyday lives about the activity or experience being studied.
Process Efficiency
Measure current processes to understand their efficiency levels and identify where there are areas for improvement.
Process Audit
Determine whether activities, resources and behaviours are sufficient to ensure efficient completion of tasks.
Understand Experiences.
Click here to learn more about Understanding Experiences.
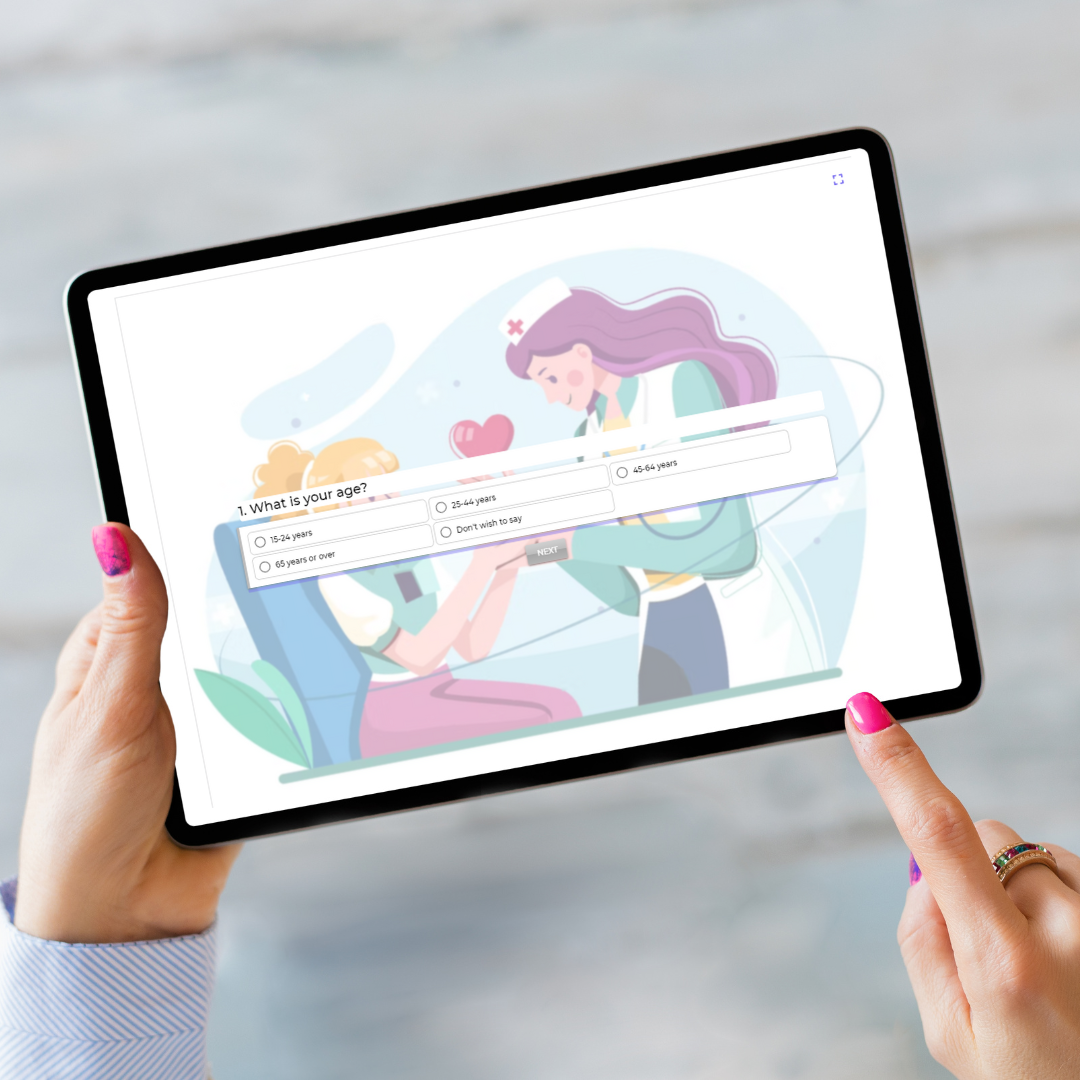
Experience Survey
Capture customer and client thoughts and feedback about their experience interacting with your business
Satisfaction Survey
Understand how satisfied customers and clients were with the service / product received from your business
PREMS
For healthcare professionals measuring a patient’s perception of their personal experience of the healthcare they have received.
PROMS
In healthcare, self-report questionnaires, completed by patients, and seek to measure their perceptions of their health status and health-related quality of life
360 Review
A performance evaluation method to gather feedback and insights for employees from all business departments.
NPS
Net Promoter Scores evaluates customer experience and loyalty to a business
Staff Review
Document employee performance identifying strengths and weaknesses and helps to set future goals.
Team Feedback
Collate feedback from certain groups to discover trends and identify potential areas for improvement.
Real Time Results.
Click here to learn more about Real Time Results.
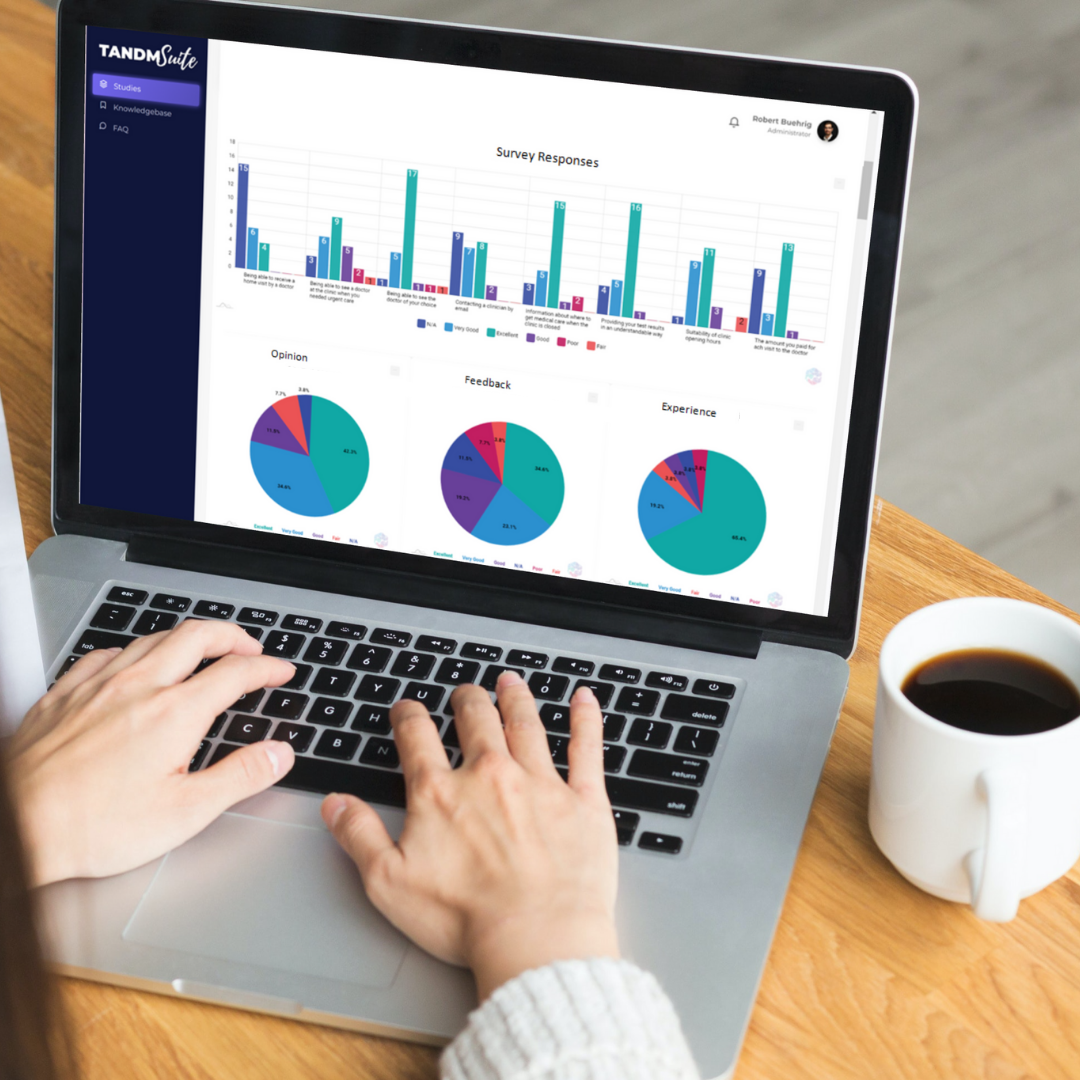
Robot Data
Use Robot Data to preview your analytics before collecting data to ensure your results will display the right information.
Preview Graphs
Build your graphs before your project kicks off so results populate as soon as data is synced.
Graph Builder
Easily build graphs to display time or cost, filtered to specific data points and customisable to size and colour specifications.
Real Time Analytics
With your Graphs pre-prepared analytics will display as soon as data is synced from your researchers. No more waiting until the end of the project to see results!
Colour Properties
Set colour preferences to suit your needs. Use brand colours, create colour uniformity across data sets and take advantage of patterns and grescale features for publication requirements.
Label Sets
Researchers can add labels to collected data from a preset list, ensuring uniformity with data collection and additional layers of analytics that can be presented.
Public Dashboards
Share your results to a wider audience by making your dashboards public, saving time in downloading an saving individual graphs.
Your Data, Your Way.
Click here to learn more about Your Data.
Media Capture
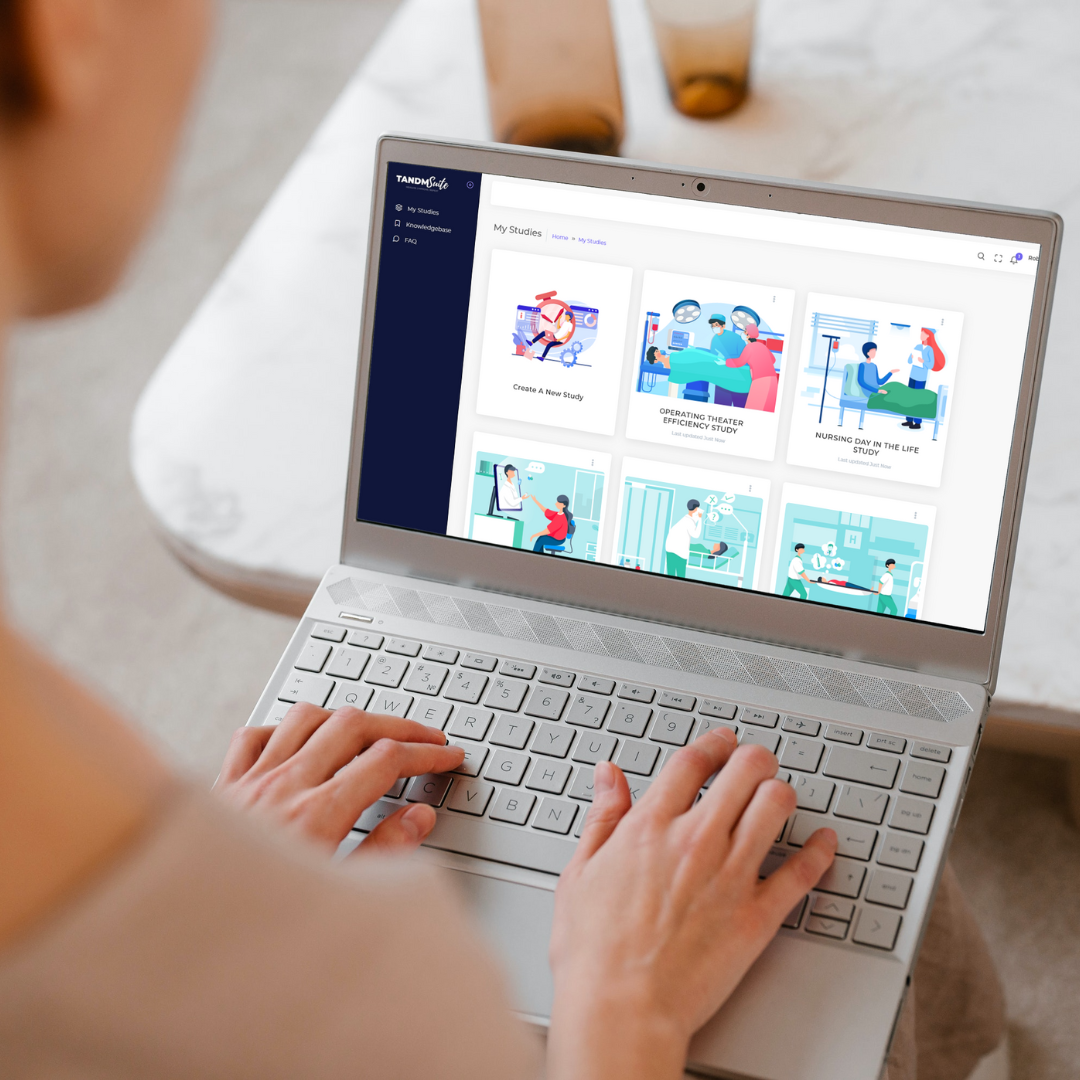
Take live photos or upload media files from your device directly through the TANDM Suite app to support data collected. Media items will display in their own Dashboard.
Mandatory Fields
Never worry about data integrity again with Mandatory Fields ensuring uniformity with data collection. Researchers will be required to enter information in order to complete timers.
Import Data
Import data via API or excel from existing data pools to create instant visualisation that contribute to your project.
Export Data
Export data collected through the tANDM Suite to use for presentations or in other data centres. Graphs can be exported as JPEG/PDF with raw data tables downloadable into excel.
Manual Timer
Manual collect time information for tasks that sit outside the scope of your TANDM Suite template or that were missed in the moment.
Emoticons
Make your surveys even more engaging with a range of emoticons to use as answer sets! Define the emoticon answer and results will display like usual.
Star Ratings
5 stars - would totally recommend!
Another engaging dynamic to include in your survey responses.
Custom Build Template
Don't be forced into using a pre-existing templates that don't match your project needs. With all the TANDM Suite data collection tools at your fingertips, you can build a template to suit every specific need of any project.
Copy Study Elements
While flexibility is key, we also believe in not having to reinvent the wheel. Every aspect of the TANDM Suite can be copied to ensure ease of use. Copy your study, template, dashboard or graph at any time and tweak as you need!
QR Code / SMS Sharing
Sharing your TANDM Suite Study has never been easier. Copy the link to email to participants, issue and SMS code, or to reach a wider audience, take advantage of the unique QR Code that's automatically created for each template.


