TOPICS COVERED:
- TRACTION
- REPORT BUILDER
- NEW GRAPHS
- PR STRATEGY
One thing I can never question about our team is their willingness to step up to a challenge. And not only step up to a challenge but knock the results out of the park.
Very early on in our journey, I watched a potential investor challenge Zoe that she couldn’t get an Investment Memorandum completed by the end of the week. Being that it was a Tuesday afternoon and we’d only just learned what an IM was, I was turning green with panic as she challenged him back with a ‘hold my beer!’ and not only produced it, but blew his socks off with the content and detail included. That was the day I knew there was no way in hell I was letting this woman out of my sights!
I’ve watched Bryce take on every single challenge of my midnight ramblings and “wouldn’t it be cool if we could do this…” comments and build out an entire suite of graph builders, template builders and analytic calculators. I think my favourite thing about Bryce is watching him finish telling me something is impossible, and then daring himself to prove himself wrong. And then he ends up building out the whole idea overnight. Now, I have known Bryce a long time, and we’ve been through many new business ideas together, but to see him in full CTO and coding flight is a thing of beauty.
Finally, there is Chris, who quite frankly got us into this whole TANDM adventure to begin with! Back in the days when we were going to build the MedWatch and change how medication rounds were completed, we were told we should do a time and motion study to test our theories. Cool! What software do we use?……….. Software? Oh no, you use paper and a stop watch for those. He too responded with a ‘hold my beer!’ and put his incredible code brain to work and developed the very first version of TANDM in a weekend. What was initially meant as a time and labour saver for us turned out to be the thing the hospital was more interested in. Chris’ imagination and ability to recreate that imagination never ceases to amaze me!
So when someone recently said to us, I’d like to see what kind of traction you can achieve (just a few weeks prior to a Global Pandemic)?
Well, I’m sure you can hazard a guess at what the team’s internal response was…..
TRACTION
Metro South
We met the Clinical Excellence team at Metro South late last year and started conversations about their efficiency projects. Christmas break and a global pandemic later, our conversations are picking up again with initial demos. The Metro South team is looking for ways to help PAH with the Elective Surgery waitlists and increase Surgical Theatre efficiencies. With an increased scrutiny on waitlist KPIs, we imagine that this will continue to be a trend for the coming months with large private and public facilities. We had a great demo with them last week, and have planned for a “test drive” in the coming weeks where they can get a feel for all the features of TANDM while we finalise the details of a 12 month subscription deal.
Hummingbird House
The Hummingbird House board have gathered again to discuss the findings of their original TANDM Suite study, and devise an implementation plan based on the recommendations from Populeux, the consulting firm using our software. Once the implementations have been fully adopted, a follow up study will be conducted, again using TANDM, to prove the value and cost savings of the changes in business strategies. For us, it is a completed case study, and a framework for future projects via our Marketplace, and provides Ester and Andrew from Populeux an established and proven framework they can use as they enter their efficiency projects with future Aged Care facilities.
a Victorian Hospital
Epworth have engaged us for a 12 month project plan to prove the value of using Consentic, an electronic consent platform. This particular project is aimed at automating informed consent methods by using an animated video instead of requiring nurses to teach orthopaedic surgeries to patients using paper forms. By comparing the differences in retention and labour hour savings, the current manual methods will used as a benchmark to calculate the ROI of going to an electronic system. They are currently predicting a significant time savings from the consent process which will ultimately result in an increased capacity to perform more research projects with their team! We’re expecting some big numbers for improvement from this one and they are already looking forward to being better able to service their patients!
This project is also leading to further discussions for efficiency studies throughout the rest of their hospital. These conversations are just beginning so watch this space!
Which leads to our next traction point….
St Vincent’s
We have been discussing a massive time and motion study project that would be almost completely digital by pulling off timings and records from several different medical systems. So far we’ve received verbal confirmation from St. Vincents, the WOMBAT team at Maquarie University, DoseMe, and Med-Eye just to name a few. The purpose of the study would be to gain a deeper understanding of medication rounds and show the differences in medication administration times to when the medical records are updated with current information. By pulling drug information and updates directly from the IV Pumps, Medical Devices, Med-Eye, DoseMe, and MedChart itself, we could theoretically show the differences in timings and begin to narrow in on the when conditions begin to devolve into a possible medication adverse event. From those of you that know the stories of Granny B and the four Cogniom founders, this project is goes directly to our core vision as a company. The next steps will be to apply for grants and funding to help kick off the project once the pandemic has eased up on St. Vincent’s research staff.
REPORT BUILDER:
I’m not sure who is more excited about this one, The Devs for this amazing creation or Zoe who has wanted a Report Builder for so long now!
The report builder means that clients can stay inside one program from start to finish on their projects; something that just isn’t possible with many other data collection tools. So many of them rely on excel exports or external calculators and third party visualisation software to complete their studies which adds to the whole problem of taking too long and being too expensive.
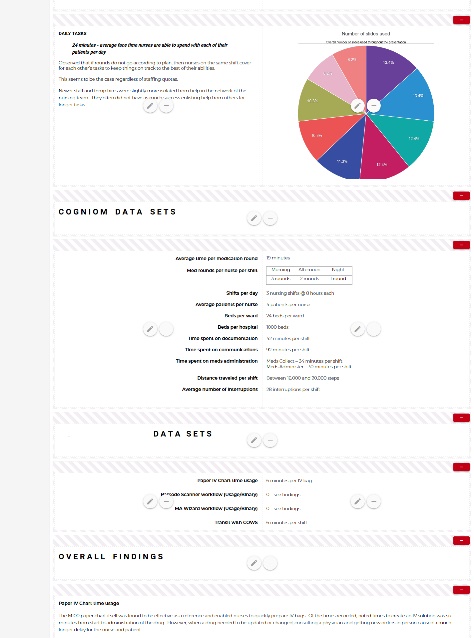
From the dashboard of graphs created from the TANDM Admin page, you can now build the components of your report to look however you want. There are areas to import graphs from ANY study your company has conducted, making cross reference and comparison incredibly easy. Text boxes can be added to include more insight and detail and are fully formattable. Company colour schemes and logos to personalize branding details are also included features. These reports can also be exported to PDF and can be saved in the TANDM Admin page for historical record keeping.
And this is just the first version! Future goals include creating ready made templates to suit a variety of report requirements like Case Studies, White Papers, and A3 Report formats. Importing of external items such as photos or other data tables, drag and drop functions and saving custom reports as your own templates for future use are now all within reach.
NEW GRAPHS:
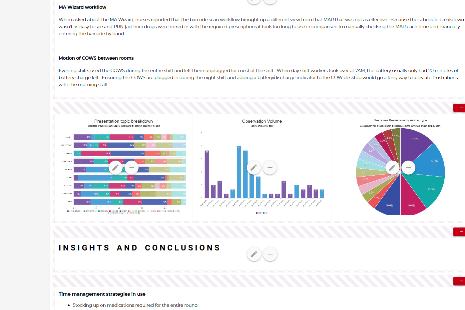
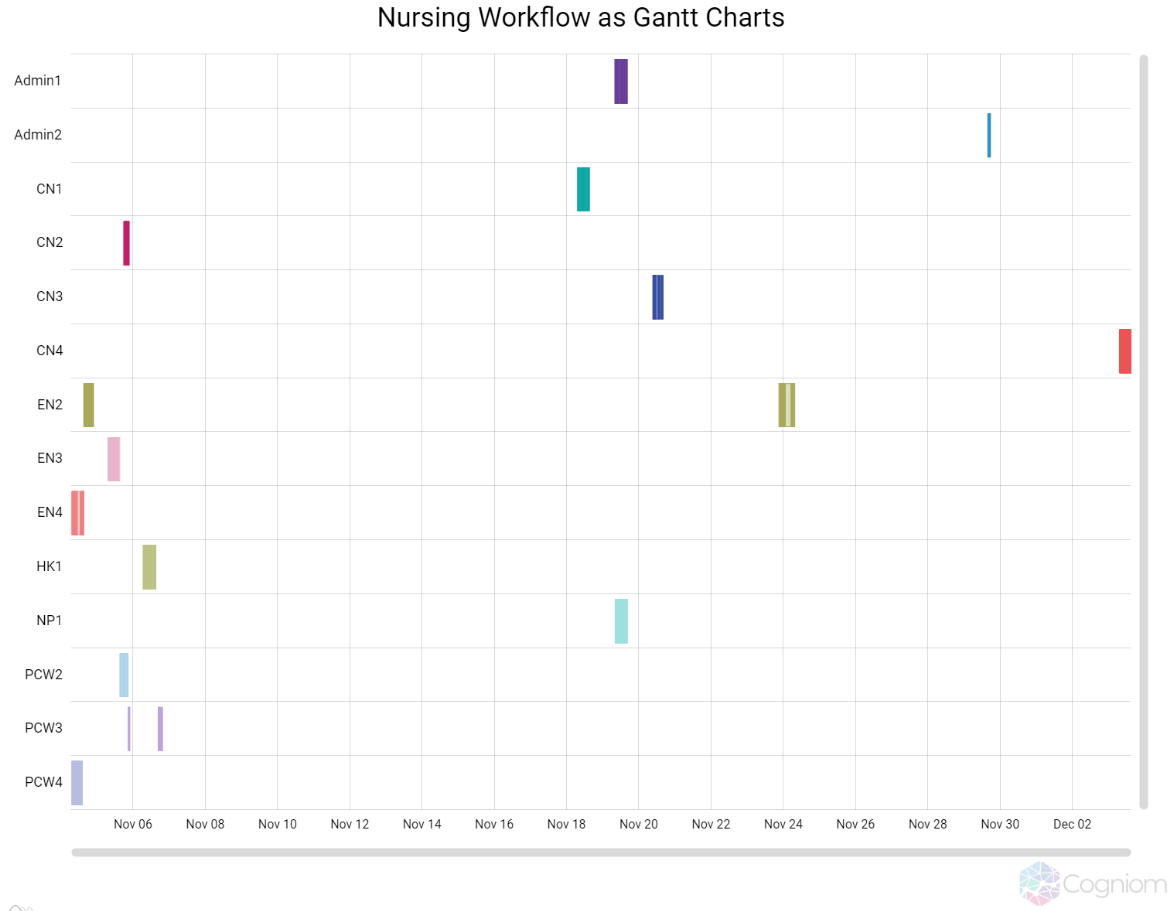
Zoe may love her report builder, but our new Gantt chart is my new beloved toy!
Why is this such a critical part of our report offerings? Because by tying time and associated costs to delays, ineffective activities, and inefficient workflows – we can now create real-time ROI Calculators. This means for example, that a tech company can quickly capture the current workflows of a potential client in days with a few key advocate and calculate their solution’s potential ROI instantly. A hospital can see what delays are occurring in operating theatres most often and the their total cost over time. Additionally, with the report builder these reports can be standardized and made repeatable – helping provide evidence for critical conversations at a moment’s notice.
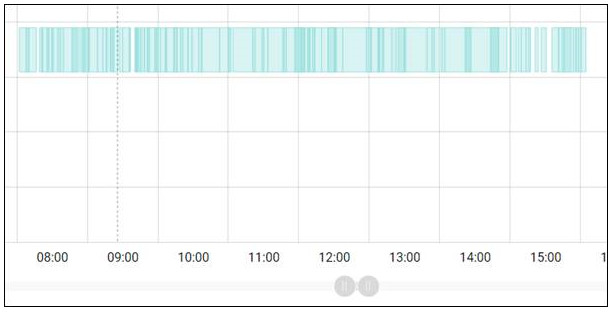
- Dynamic Time scale – Use the scrollbar to zoom or drag the mouse over the area you want a closer look at and the chart will zoom in down to minutes and even seconds to give you the most detailed look at your data.
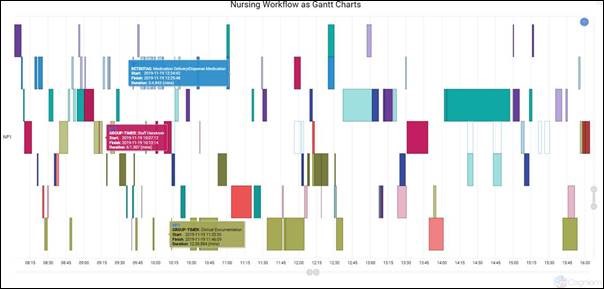
- Category – Clicking on a category listed on left hand side of the chart will automatically zoom in to the data collected for that particular observed party. You’ll be able to see the individual activity types per rows, allowing you to identify the repeating patterns where time is being spent the most. Now we can see the total percentage of time lost from delays and the cost breakdown in terms of lost equipment and labour for the entire workflow’s duration.
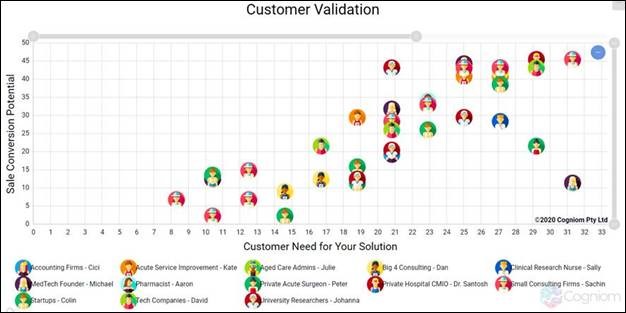
We’ve also included Scatter Images to our library:
This next level scatterplot chart maps a single data point for every customer validation interview. This is especially helpful when used for groupings, like Customer to Market Type studies, allowing the user to easily identify different groups that have the highest sales potential and urgency.
On the TANDM Dashboard the graphs are fully interactive, allowing the user to zoom in on a specific area, or focus attention on one group in particular.
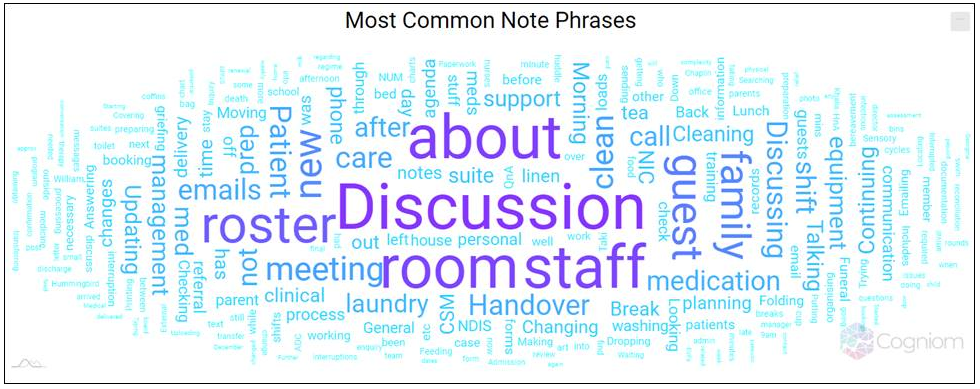
And lets not forget about the awesome Word Clouds!:
With popularity and functionality of our TANDM Survey study option growing, the word cloud graph type gives an instant visual on the topics most talked about throughout your study. This is a great way to show the Notes and Insights collected to quickly identify trends.
PR STRATEGY:
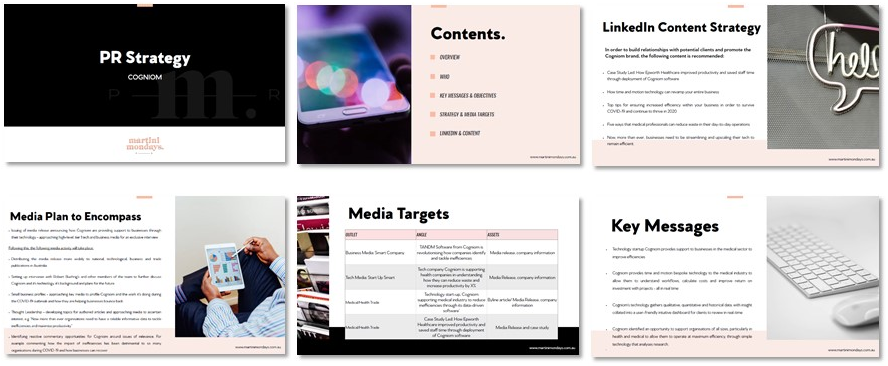
One of the best things about being a start up is how the little things mean so much and invoke great joy and celebration. This week, we were presented with our very first PR strategy for a very targeted campaign into healthcare and business tech publications. We have teamed up with Martini Mondays here in Brisbane – introduced to us by our investor Chris Hewson (thank you!) – who we have worked with over the last month to hone in on our messaging and goals, and the best approach to achieve maximised outcomes. For the first time, we have a very detailed structure and clear path forward when it comes to getting our message across. Our efforts this month with LinkedIn marketing alone has generated the highest level of enquiry outside networked referrals and introductions we’ve ever seen, so we are confident the impact of this campaign will be great.
Thank you as always for your support!! If you love our updates and want to know how you can help create them, this is how you can jump on board:
Who wants to help finish out our Pre Seed Round? We’re very close to finishing and only have a limited amount left to offer!
Is there someone in your network would benefit from a TANDM Study?
- Tech Companies needing to prove their ROI for a proposal?
- Startups needing help validating their idea with potential customers?
- Private Surgeons needing to capitalize their limited time in operating theaters?
- Improvement teams looking to drive efficiencies for COVID-19 planning?
If you know of someone that could use some help, please send them our way!

Just like most things in Cogniom, there is still so much happening in the background that just isn’t quite ready to come out from under the covers just yet. Bryce and Chris are working on some incredibly cool features, which is set to round out another MAJOR tech capability. But they have sworn me to secrecy until the release.
Zoe has an awesome ace up her sleeve which she is CHOMPING at the bit to tell you about, but has been forbidden from discussing it until we get approval.
And I have some really exciting sales news to share as well – but alas, it’s still under wraps until next week!
I know, I know, I don’t like waiting either, but Zoe says I’m not allowed to disclose this stuff yet! Rather than waiting any longer, I’m sending out an update now and you’ll just have to join us for the next update when we unload a heap of surprises!
Until next time!